
USD CAD Technical Analysis September 19, 2018
The USD declined 0.51% against the CAD on Tuesday and closed at 1.2973. Today in European session while USD CAD technical analysis September 19, 2018 is preparing at at 10:45 GMT, the USD/CAD trading at 1.2950, which is 0.17% lower against CAD from yesterday’s close.
In US session, the Canidian data showed that the Manufacturing sales increased for the third consecutive month in July, rising 0.9% to $58.6 billion. Higher sales in the transportation equipment and chemical industries drove the increase. Chart 1 Chart 1: Manufacturing sales increase Manufacturing sales increase Chart 1: Manufacturing sales increase Overall, sales were up in 11 of 21 industries, representing 68% of total manufacturing sales. Non-durable goods rose 1.4% to $27.7 billion, while durable goods increased 0.5% to $30.9 billion. Constant dollar sales increased 1.0%, indicating that a higher volume of goods was sold in July.
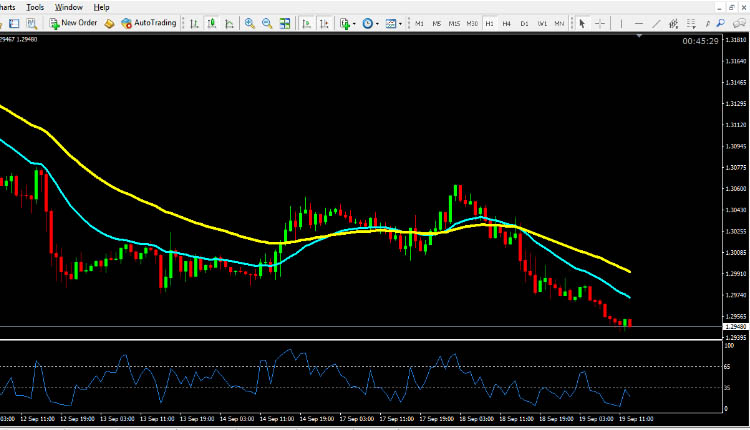
USD CAD technical analysis September 19, 2018
The pair is expected to find the support at 1.2940 and a fall through could take it to the next support level of 1.2910. The pair is expected to find its first resistance at 1.3035, and a rise through could take it to the next resistance level of 1.3095. For today the expected trading range is between 1.2910, Support and 1.3035 Resistance.
The expected trend for today is Bearish
Supports Levels: Support 1: 1.2940 Support 2: 1.2910 Support 3: 1.2850
Resistance Levels: Resistance 1: 1.3035 Resistance 2: 1.3095 Resistance 3: 1.3127
Previous day`s high: 1.3033
Previous day`s low: 1.3000
USD/CAD Buying Opportunity for Intraday Trading September 19, 2018
Buy near the support area 1.2040 and 1.2910 as soon as you get reversal candlesticks patterns like Hammer, Bullish Englufing, Long Leged Doji or Dragonfly Doji
USD/CAD Selling Opportunity for Intraday Trading September 19, 2018
Sell near the resistance area 1.3035 and 1.3095 as soon as you get reversal candlesticks patterns like Shooting Star, Bearish Englufing, Long , Leged Doji or Gravestone Doji
EUR/USD Technical Analysis September 19, 2018
GBP/USD Technical Analysis September 19, 2018
USD/JPY Technical Analysis September 19, 2018