Easy Trading Tips offers free forex and commodities technical analysis, trading forecast, latest stock market, forex, commodities & business news, real time quotes, live charts, live markets data, economic calendar and many more.

Multiple Forex Charts

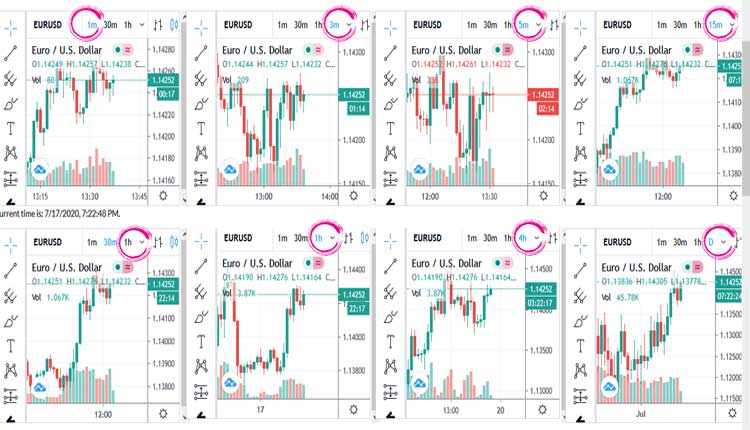
Multiple Forex charts provide real-time currency prices updated every second without refreshing the page. On our real-time charts, you can use various tools to analyze your chosen currency pair or instrument, change the time period, and analyze the market using a number of technical indicators.

Example
<

Multiple Forex Charts on the same screen

The multiple Forex charts displaying multiple chart time-frames. There are some traders who like to look at a single time frame when trading Forex. Whether it is a 15-minute, 30-minute, 1-hour, 4-hour, or daily chart. However, many forex traders will agree that it is much easier to make money on Forex by looking at the price action over two or more time periods to get a good idea of the prevailing long-term trend.

You can do this by simply switching charts manually or using multiple monitors.  But in our “multiple Forex charts”, you can see multiple charts on one screen.

The Benefits of Looking Multiple Forex Charts When Trading

Monitor Trends on Multiple Time Frames

Multiple time frame analysis in the Forex market is the process of viewing the same currency pairs over different time periods. Typically, larger time frames, such as 4 hours, daily and weekly, are used to establish long-term trends, while we can use shorter time frames to enter the market.


Multiple Forex charts are very useful to day traders. Day traders usually have a whole day to follow the charts to find the best trading signals, and so can trade with a small time frame. These range from 5 minutes to 15 minutes. If you are trading on a 15-minute chart, you should look at the 30-minute, 1-hour, four-hour, and 1-day time charts. If you are trading on a 1-hour chart, you should check the 4-hour, daily, and weekly charts, etc.

On our multiple Forex charts, it is very easy to see whether the price is moving up or down on all time frames.