
USD JPY Technical Analysis September 19, 2018
The USD rose 0.45% against the JPY on Tuesday and closed at 112.35. Today in the European session while USD JPY technical analysis September 19, 2018 is preparing at 10:45 GMT, the USD/JPY trading at 112.30, which is 0.04% lower against JPY from yesterday’s close.
In Asian session, data showed that the Japanese exports rose 6.6% year-on-year to 6.69 trillion yen in August 2018, up from 3.9% in July and 5.6% higher than expected. Growth is driven primarily by manufactured goods, chemicals and motors.
Japan’s trade balance: Japan’s trade deficit in August 2018 was 444.6 billion yen, compared with a trade deficit of 96.8 billion yen in the same period last year, while the market estimated gap was 468.7 billion yen. This is the second consecutive month of trade deficit, mainly due to the surge in imports. Compared with the same period of last year, inbound cargo volume increased by 15.4% to 7.1 trillion yen, higher than the market expectation of 14.9% growth and July growth of 14.6%.
Japanese interest rate: Japan’s benchmark interest rate was last recorded at -0.10%. From 1972 to 2018, Japan’s interest rate averaged 2.82%, hitting a record high of 9% in December 1973, and hit an all-time low of -0.10% in January 2016.
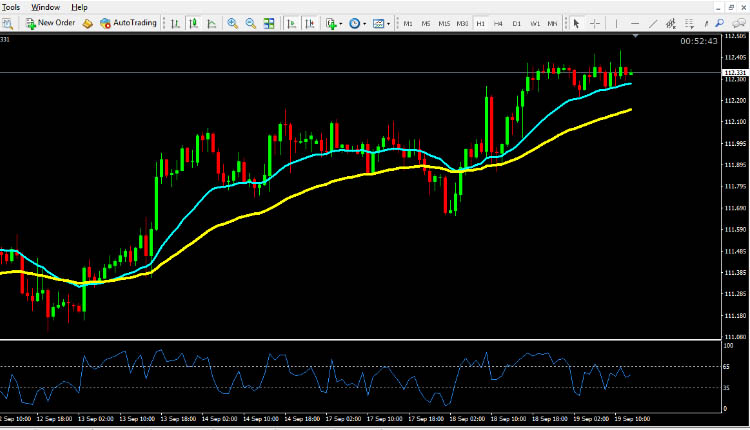
USD JPY technical analysis September 19, 2018
The pair is expected to find support at 112.10. And a fall through could take it to the next support level of 111.87. The pair is expected to find its first resistance at 112.60, and a rise through could take it to the next resistance level of 112.85. For today the expected trading range is between 111.87, Support and 112.60 Resistance.
The expected trend for today is Bullish
Supports Levels: Support 1: 111.87 Support 2: 111.40 Support 3: 111.15
Resistance Levels: Resistance 1: 112.60 Resistance 2: 112.85 Resistance 3: 113.33
Previous day`s high: 112.38
Previous day`s low: 111.65
USD/JPY Buying Opportunity for Intraday Trading September 19, 2018
Buy near the support area 111.70 and 111.55 as soon as you get reversal candlesticks patterns like Hammer, Bullish Englufing, Long Leged Doji or Dragonfly Doji
USD/JPY Selling Opportunity for Intraday Trading September 19, 2018
Sell near the resistance area 112.60 and 112.85 as soon as you get reversal candlesticks patterns like Shooting Star, Bearish Englufing, Long Leged Doji or Gravestone Doji
EUR/USD Technical Analysis September 19, 2018
GBP/USD Technical Analysis September 19, 2018
USD/CAD Technical Analysis September 19, 2018