Easy Trading Tips offers free forex and commodities technical analysis, trading forecast, latest stock market, forex, commodities & business news, real time quotes, live charts, live markets data, economic calendar and many more.

Forex Technical Analysis

Easy Trading Tips provides daily Forex technical analysis of some major currency pairs and commodities. Our Forex analysis is based on recent market trends, technical indicators, and support and resistance levels. You can find the latest technical analysis below.

What is Forex Technical Analysis?

Forex Technical analysis is often used to generate short-term and long-term trading signals from various charting tools. It also helps to improve the evaluation of market strength and future direction. This forex technical analysis technique can help analysts to improve the overall valuation estimate of any security. This includes currencies, stocks, futures, commodities, and other securities.

Many traders and investors analyze the market based on their fundamental analysis (such as revenue, valuation, or market trends), but the fundamental factors are not always reflected in the market price. Most traders and investors use fundamental and forex technical analysis to make decisions before entering the trade. “Forex technical analysts” pay special focus to price charts in different time frames.

Forex Technical Analysis in Different Time Frames

The time shown on the chart ranges from 1 minute to monthly or even yearly. The most popular timeframes that technical analysts check include:

  • 5-minute chart

  • 15-minutes chart

  • 1-hour chart

  • 4-hour chart

  • 1-day chart

  •  weekly charts

The time a trader chooses to learn usually depends on the trader’s personal trading style. Intra-day traders want to analyze price movements in a shorter time frame, such as 1-minute, 5-minute, or 15-minute charts. Long-term traders who hold market positions overnight for a long time want to use 1 hour, 4 hours, daily, or even weekly charts to analyze the market.

1. Scalper time frames

Scalping strategy in forex technical analysis is a very short-term trading strategy, and the time that traders focus on holding positions ranges from a few seconds to a few minutes. These are called scalping transactions because they try to make small changes in scalping and only use a few pips (1-5 pips) to close the trading position. Scalping involves opening and closing trading positions in a short period of time from seconds to minutes.

The Forex scalpers specialize in trading major currency pairs, especially the EUR/USD, GBPUSD, USD/JPY, etc. Because the spread of major currency pairs is very low. scalpers need the tightest spreads and fastest trading technology, which is why they only trade with True ECN Forex brokers. It is called “scalping” because traders who adopt this style are called “scalping.”

It requires forex technical analysis traders to have risk management strategies for entering and exiting trades, because a large loss may eliminate many small gains for traders. Learning what is required for successful scalping can help scalpers to sustain the scalping. Therefore, to become the best trader, deep forex technical analysis is required.

2. Day trading time frames

The day trading Forex technical analysis strategy is a short-term trading strategy that requires traders to hold positions only during their scheduled trading days. Before the end of the trading day, day traders usually close all open positions, regardless of their profit or loss. The time range associated with day traders usually ranges from minutes to hours, depending on market conditions and trading analysis.

For intra-day trading, the 15-minute time frame chart may be very important because a trader is looking for opportunities to profit from price fluctuations that occur within a trading day. This type of foreign exchange trader uses various forex technical analysis methods to make correct trading decisions and thus succeed. Some traders use technical indicators and analysis to calculate favorable time frames for entry and exit, while others use support & resistance, trend lines, chart patterns, and candlestick patterns.

Usually, the day trader opens the trade with their forex technical analysis and holds the trading position, rather than fundamental data analysis. Day traders profit from short-term price changes in securities. Some day traders use economic news releases to trade, such as a country’s economic statistics, unemployment rates, interest rates, etc. These economic news will cause major changes in the market when they met or exceed them, thus bringing profits to day traders. The best forex brokers for scalping: IC MARKETS

3. Swing Trader time frames

Forex swing traders are those who make a profit in the foreign exchange market by maintaining a trading position for several hours or even a day to several weeks. These traders use Forex technical analysis and fundamental analysis. The goal of swing traders is to trade large price fluctuations every day by spending a long time (such as weekly and monthly).

Swing traders buy securities when the market moves up, and sell securities when the market moves down. Their focus is usually based on specific assets that they can analyze well. This helps them better understand the movement of the specific assets. Swing trading is accompanied by a lot of experience in the markets they trade.

Swinging traders make higher returns than buying and holding investors, and this aspect is most suitable for those who trade for a living. Compared with other types of traders, swing trading is less risky. For swing traders, timing is more important compared to a day trader.

4. Position trading time frames

Position traders are those who hold trades for longer periods (from weeks to years). As the longest holding period among trading styles, positions traders less interest in the short-term price fluctuations of assets, they are more concerned about the performance of longer and sustainable time frames. These traders are not as active as other traders. They rarely initiate few trading positions in specific markets throughout the year.

As foreign exchange position traders, traders need to be patient because their money is often held for a long time. These transactions focus on fundamental analysis and forex technical analysis. Extensive consideration and forex analysis will enable position trading in any currency pair.

Position trading is based on in-depth research on forex technical analysis. If you have access to accurate facts and you can see trends, then this is the best way to invest in position traders. Most traders who invest in this way will buy when the trend begins to gain momentum and sell when the trend reaches its peak and begins to decline.

Different Types of Charts used in Forex Technical Analysis

In order to study the price movements of currency pairs, we need to view their historical prices and current price behavior. For this, we need to read forex charts. A chart is a graphical representation of the historical price movements of currency pairs in different time frames. By analyzing these price trends, traders can identify existing or upcoming trends. This forex technical analysis helps traders make trading decisions. Three main types of charts are used in forex technical analysis.

  • Line Chart

  • Bar Chart

  • Candlestick Chart


Line Chart

The line chart is the basic chart, which only shows the closing prices of a currency pair over a period of time, and without a live chat, we can not make a forex technical analysis. A continuous line is formed by connecting these closing price points on the chart. Since these charts only show-closing prices, they can be helpful in avoiding price noise during the trading time. This chart is often used to visualize data and market trends over an interval of time.

we can use line charts in any time frame. These charts may be useful for new traders, especially before learning more advanced charts, to learn the basics of chart reading. The line chart gives traders a clear visualization of the prices, that is, the movement of the security`s price in a specific time period. Since it shows only the closing price, therefore it reduces all noise, such as the highs and lows and opening prices.

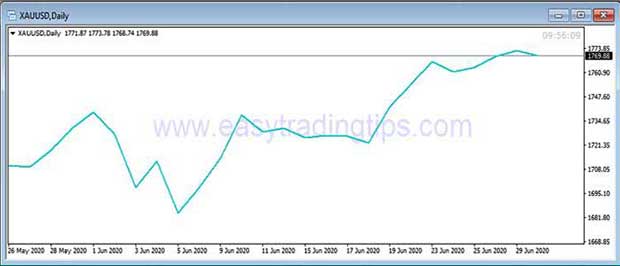
Line charts help to build the most accurate support and resistance levels using horizontal or trend lines. With the help of line charts, we can find other chart patterns such as head and shoulders, double top/double bottom, flags, and other price patterns. The chart is easy to know the market trend. The following is a daily gold line chart. Without adding any other indicators, your eyes will immediately see gold rising in an uptrend.

Forex Technical Analysis


Bar Chart

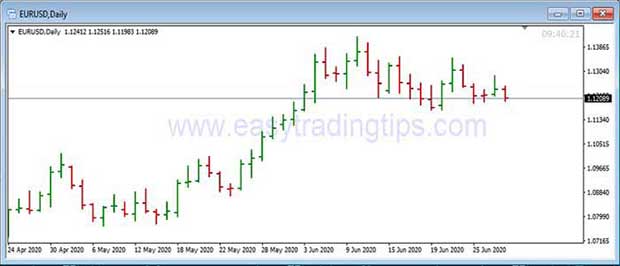
Bar charts provide more market information than line charts, such as opening price, highest price, lowest price, and closing price. A vertical line represents the highest price and the lowest price of the selected period, while two horizontal small lines show the opening price and closing price. Bars with a closing price higher than the opening price are called rising bars or bullish bars.  In a bearish bat, the closing price is lower than its opening price.

Bar charts are available in trading software, with different time frames suitable for trader strategies. We can see the bar chart in 5-minute bars, 15-minute bars, 1-hour bars, 4-hour bars, 1-day bars, etc. The daily bar chart shows the daily price bar. Each bar chart shows the opening price, the highest price, the lowest price, and the closing price (OHLC) of the period. The following is a bar chart of EUR/USD in the daily time frame.

Technical Analysis


Candlestick Chart

The candlestick chart is the most widely used chart in forex technical analysis. Candlestick charts are the most popular charts among forex traders because they are more visual than line and bar charts. The candlestick is called “Japanese candlestick” because it was first developed by Munehisa Homma in Japan in the 1700s.

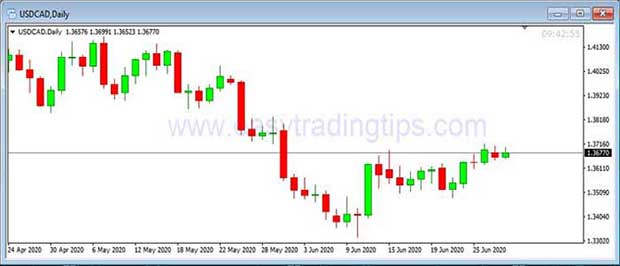
These chart patterns provide us with a lot of information to decide when to enter or exit the transaction. Although these charts provide the same information as bar charts, the color-coding of the candles makes it easier for traders to identify market trends. Green/white candlesticks represent bullish price momentum, while red/black candlesticks represent bearish momentum.

candlestick pattern


In the forex technical analysis, traders use several candlestick patterns, such as hammers, shooting star, bullish engulfing, Doji, etc. These candlestick patterns can help traders predict price movements. For example, Hummer and bullish engulfment tell us that the bearish trend is over and the bullish trend will start soon. Similarly, shooting star and bearish engulfs provide clues to the beginning of a bearish trend. There are hundreds of such candlestick patterns, but it is important to know the top 10 most powerful candlestick patterns.

Technical Summary 

Technical Summary Widget Powered by Investing.com