Support and Resistance
Support and resistance are very important trading points in forex trading. These levels are formed by multiple touches of prices, without breaking through this level. Support and resistance areas provide traders with many clues about the market and how to trade with these levels.
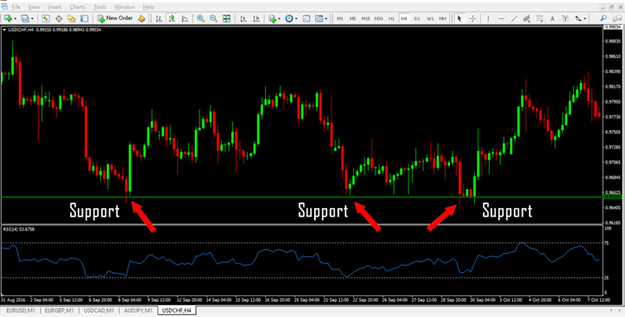
Support
A support level is a level where the price tends to find support after a falling down, these support levels tend to stop the price from falling below. In the chart above, you can see that whenever the price reaches the support level, it is difficult to penetrate this level. When the price falls below the support level, it may continue to fall until it reaches another support level.
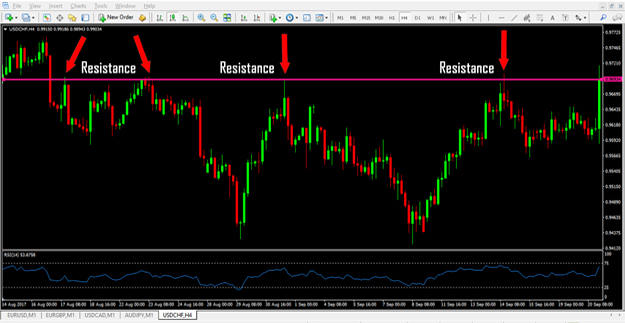
Resistance
A resistance level is opposite to support. When prices rise, they often find the resistance to take a rest. On the other hand, it refers to the price level at which the supply (sales pressure) is strong enough to prevent further price increases. In the chart above, you can see that it is difficult to move higher whenever the price reaches the resistance level. Once the price breaks through this level, it may continue to rise until it reaches another resistance level.
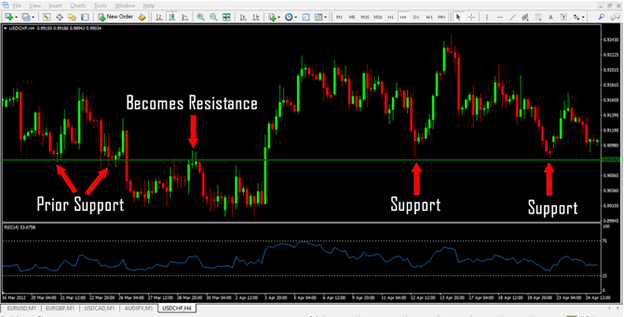
Identifying support and resistance levels
There are different types of support and resistance levels. These levels can be determined by horizontal lines and trend lines. Some traders think that they can be calculated using pivot points. If the price breaks through the support level, the support level will usually become the new resistance level; if the price breaks through the resistance level, the support level will usually be found at this level in the future.
 In a downward trend, prices form lower lows and lower highs. In an upward trend, prices form higher highs and higher lows. By connecting these highs and lows in the trend, we can find support and resistance levels. Then, extend the line to the right to see where the price may find support or resistance in the future.