
Gold Technical Analysis September 19, 2018
The Gold declined 0.26% against the USD on Tuesday and closed at 1198.00. Today in the European session while Gold technical analysis September 19, 2018 is preparing at 10:15 GMT, the XAU/USD trading at 1200.03, which is 0.41% higher from Yesterday’s close.
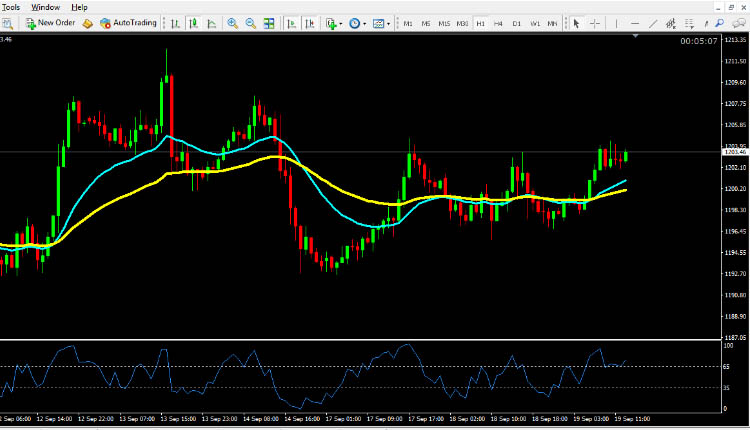
Gold regained some positive momentum on Wednesday, with the current trading price slightly above the $1,200 mark, near the top of its three-day narrow trading range. After yesterday’s modest recovery attempt, the dollar continued to be bearish and was seen as one of the key factors benefiting from dollar-denominated commodities such as gold.
Gold technical analysis September 19, 2018
The Gold is expected to find support at 1194.00, and a fall through could take it to the next support level of 1191.00. The pair is expected to find its first resistance at 1207.00, and a rise through could take it to the next resistance level of 1210.00. For today the expected trading range is betwee 1194.00, Support and 1210.00 Resistance.
The expected trend for today is Bullish
Supports Levels: Support 1: 1194.00 Support 2: 1191:00 b Support 3: 1187:00
Resistance Levels: Resistance 1: 1203.00 Resistance 2: 1207.00 Resistance 3: 1210.00
Previous day`s high: 1203.41
Previous day`s low: 1195:60
Gold Buying Opportunity for Intraday Trading September 19, 2018
Buy near the support area 1194.00 and 1191.00 as soon as you get reversal candlesticks patterns like Hammer, Bullish Englufing, Long Leged Doji or Dragonfly Doji, using stop loss 2 pips below the reversal candlestick & keep target equal to stop loss.
Gold Selling Opportunity for Intraday Trading September 19, 2018
Sell near the resistance area 1207.00 and 1210.00 as soon as you get reversal candlesticks patterns like Shooting Star, Bearish Englufing, Long Leged Doji or Gravestone Doji, using stop loss 2 pips above the reversal candlestick & keep target equal to stop loss.