
GBP USD Technical Analysis September 19, 2018
The GBP declined 0.07% against the USD on Tuesday and closed at 1.3146. Today in the European session while preparing GBP USD technical analysis September 19, 2018 at 10:15 GMT, the GBP/USD is trading at 1.3175, which is 0.22% lower against the USD from yesterday’s close.
When the European market opens, the economic data will release such as UK interest rate: From 1971 to 2018, the UK’s interest rate averaged 7.57%, hitting a record high of 17% in November 1979 and hit a record low of 0.25% in August 2016.
UK inflation rate: From 1989 to 2018, the UK’s inflation rate averaged 2.58%, reaching an all-time high of 8.50% in April 1991 and a record low of -0.10% in April 2015.
UK core inflation rate: From 1997 to 2018, the UK’s core inflation rate averaged 1.63%, reaching an all-time high of 3.70% in April 2011, and hit an all-time low of -0.10% in June 2000.
UK inflation rate MoM: Inflation rate The mother of the United Kingdom averaged 0.21% from 1988 to 2018, reached an all-time high of 3.37% in April 1991, and hit a historical low of -0.94% in January 2000.
GBP USD technical analysis september 19, 2018
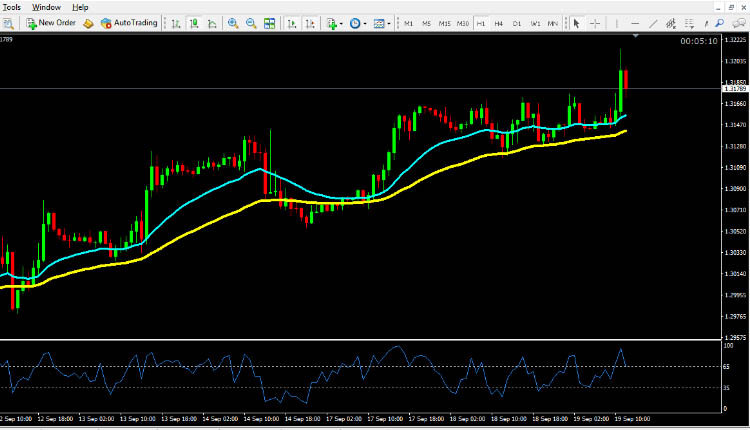
The pair is expected to find support at 1.3120, and a fall through could take it to the next support level of 1.3090 The pair is expected to find its first resistance at 1.3200, and a rise through could take it to the next resistance level of 1.3230. For today the expected trading range is between 1.3090, Support and 1.3230 Resistance.
The expected trend for today is Bullish
Supports Levels: Support 1: 1.3120 Support 2: 1.3090 Support 3: 1.3065
Resistance Levels: Resistance 1: 1.3173 Resistance 2: 1.3200 Resistance 3: 1.3230
Previous day`s high: 1.3171
Previous day`s low: 1.3117
GBP/USD Buying Opportunity for Intraday Trading September 19, 2018
Buy near the support area 1.3120 and 1.3090 as soon as you get reversal candlesticks patterns like Hammer, Bullish Englufing, Long Leged Doji or Dragonfly Doji, using stop loss 2 pips below the reversal candlestick & keep target equal to stop loss.
EUR/USD Selling Opportunity for Intraday Trading September 19, 2018
Sell near the resistance area 1.3200 and 1.3230 as soon as you get reversal candlesticks patterns like Shooting Star, Bearish Englufing, Long Leged Doji or Gravestone Doji, using stop loss 2 pips above the reversal candlestick & keep target equal to stop loss.
EUR/USD Technical Analysis September 19, 2018
USD/JPY Technical Analysis September 19, 2018
USD/CAD Technical Analysis September 19, 2018