Easy Trading Tips offers free forex and commodities technical analysis, trading forecast, latest stock market, forex, commodities & business news, real time quotes, live charts, live markets data, economic calendar and many more.

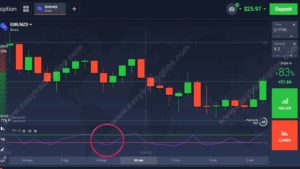
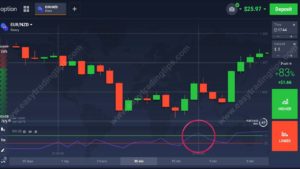
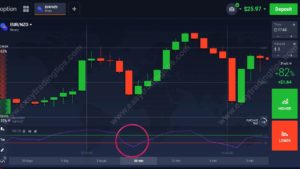
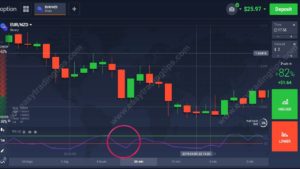
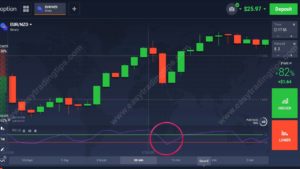
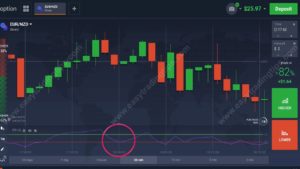
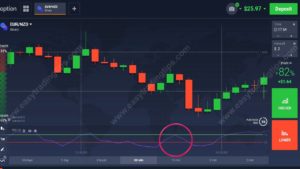
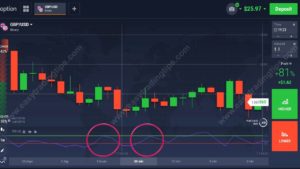
RSI Signal Pictures


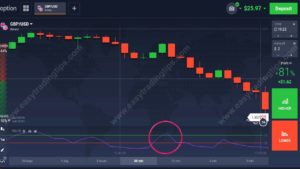
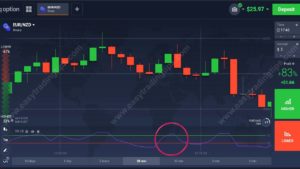
The Relative Strength Index (RSI) is a momentum indicator used to measure the magnitude of recent price changes to evaluate overbought or oversold prices of stocks or other assets. It is used for technical analysis of financial markets. The RSI is most commonly used for a 14-day timeframe. The oversold and overbought levels are labeled 70 and 30, respectively, from 0 to 100. However, for our RSI strategy for binary options trading, we recommend a 4-day timeframe. Oversold 70 and oversold 30. Let’s take a look at the top 15 candlestick patterns.

 

RSI


RSI
 
RSI


RSI 


RSI


RSI


RSI


RSI


RSI


RSI

 Central BanksInterest RatesLast Change 
  FED1.50%12-13-2017 
  ECB0.00%03-10-2016 
  BOE0.50%11-02-2017 
  SNB-0.75%01-15-2015 
  RBA1.50%08-02-2016 
  BOC1.00%09-06-2017 
  RBNZ1.75%11-10-2016 
  BOJ-0.10%02-01-2016 
  RBI6.00%08-02-2017 
  PBOC4.35%10-23-2015 
  BCB7.00%12-06-2017 
  CBR7.75% 12-15-2017