RSI Three
RSI Example Three
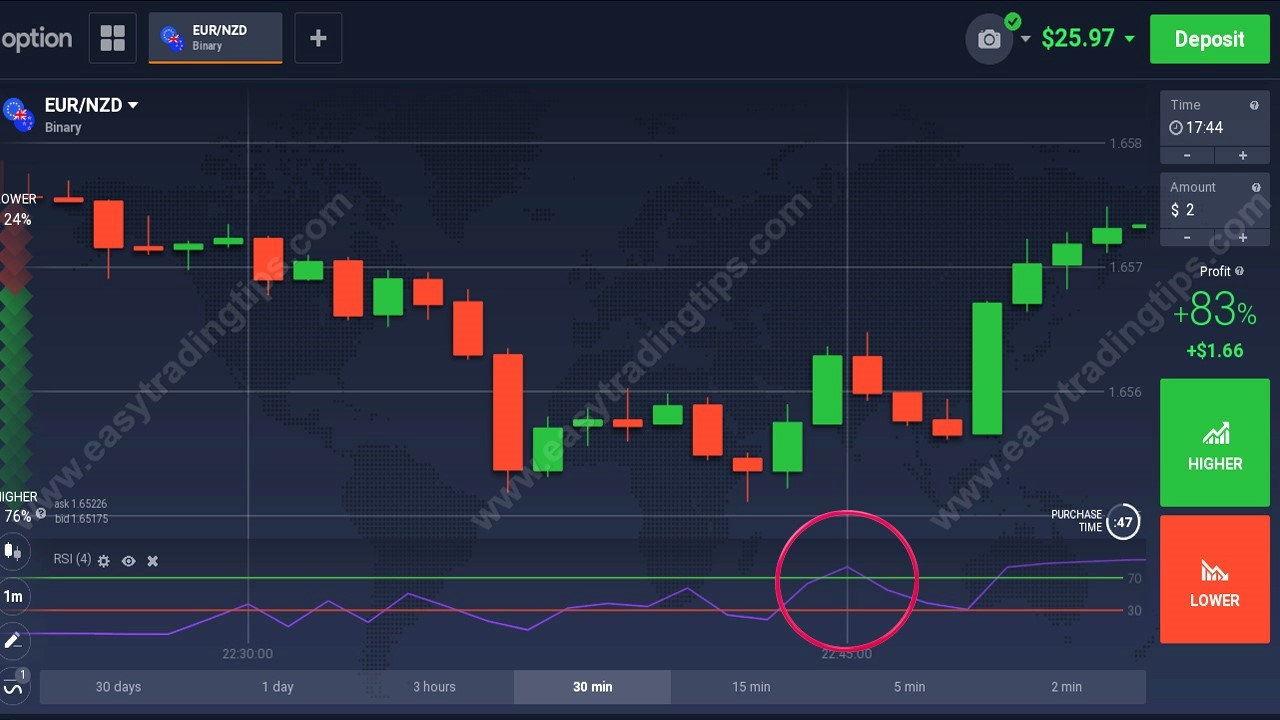
The Relative Strength Index (RSI) is a popular momentum oscillator. It is used to determine the future direction of the market. It can also be used to assess whether a stock is overbought or oversold. RSI is a popular technical analysis tool that helps traders identify and create trading opportunities in the markets. The index produces an indicator between 0 and 100. According to Wilder, when the index reading is above 70, the RSI is overbought. When the index is below 30, it is oversold.