RSI One
RSI Example One
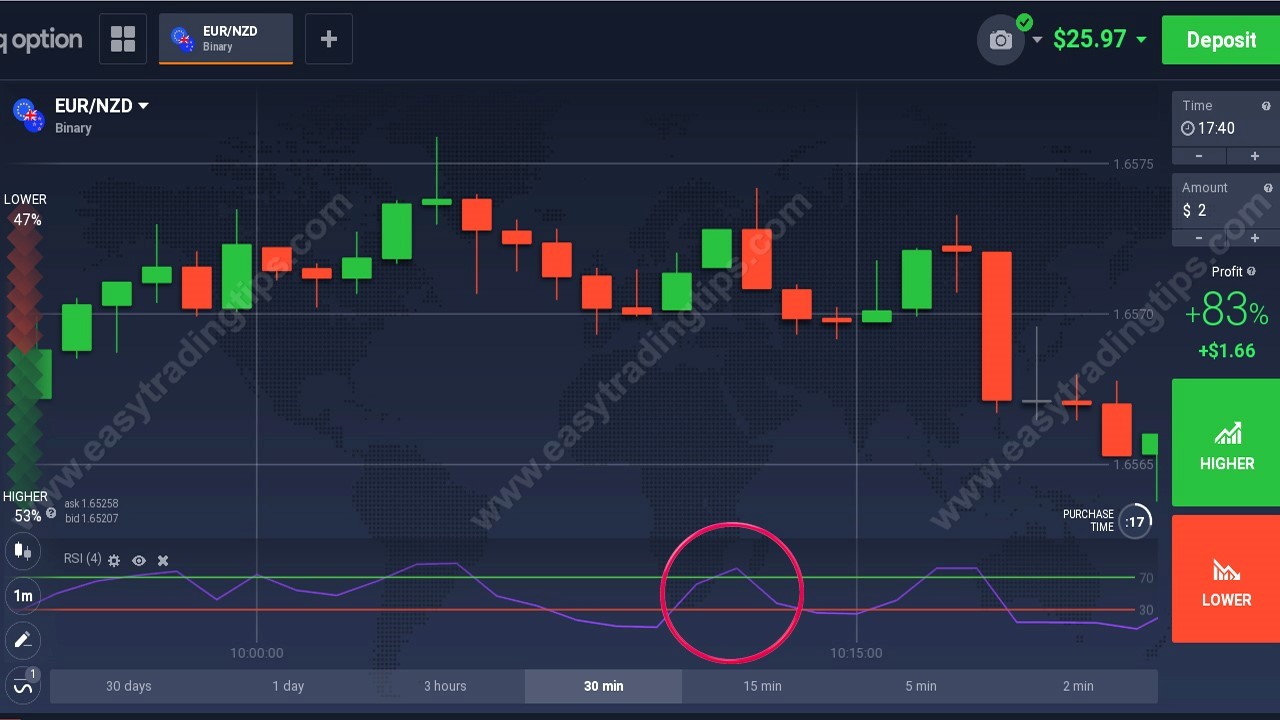
The Relative Strength Index (RSI) is one of the most popular technical indicator which help you to determine the level of overbought and oversold prices and generate trading signals. In RSI, past prices are used to calculate numbers between 0 and 100. These numbers are RSI readings. The way RSI works is mainly because the indicator falls when the price of the asset itself falls, and rises when the asset price rises. A sharp or long-term decline in prices will drive the RSI close to 0. A major or long-term rise will drive the RSI close to 100.