
USD CAD Technical Analysis September 24, 2018
The USD rose 0.12% against the CAD on Friday and closed at 1.2916. Today in European session while USD CAD technical analysis September 24, 2018 is preparing at at 8:45 GMT, the USD/CAD trading at 1.2930, which is 0.10% lower against CAD from yesterday’s close.
In US session, data showed that the In July 2018, Canada’s retail sales increased by 0.3% quarter-on-quarter, a slight increase from the 0.1% cut last month, but the market expectation is 0.4%.
Canadian inflation rate: Canada’s inflation rate fell from 3% in July to 2.8% in August 2018, the highest inflation rate since September 2011. The data is in line with market expectations. The transport index has slowed, but it is still the biggest factor in the year-on-year increase in consumer prices.
Canadian core inflation rate: Canada’s annual core inflation rate rose from 1.6% in the previous month to 1.7% in August 2018, higher than market expectations of 1.4%.
Canadian inflation rate: In August 2018, the Canadian consumer price index fell by 0.10% from the previous month. Inflation rate Canada’s mother averaged 0.29% from 1950 to 2018, hit a record high of 2.60% in January 1991, and hit a record low of -1.30% in June 1959.
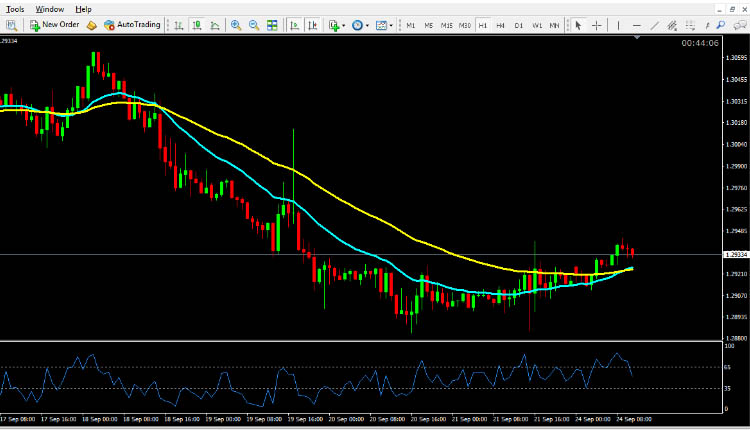
USD CAD technical analysis September 24, 2018
The pair is expected to find the support at 1.2885 and a fall through could take it to the next support level of 1.2855. The pair is expected to find its first resistance at 1.2945, and a rise through could take it to the next resistance level of 1.2972. For today the expected trading range is between 1.2900, Support and 1.3136 Resistance.
The expected trend for today is Bullish
Supports Levels: Support 1: 1.2885 Support 2: 1.2855 Support 3: 1.2830
Resistance Levels: Resistance 1: 1.2945 Resistance 2: 1.2972 Resistance 3: 1.3000
Previous day`s high: 1.2942
Previous day`s low: 1.2884
USD/CAD Buying Opportunity for Intraday Trading September 24, 2018
Buy near the support area 1.2885 and 1.2855 as soon as you get reversal candlesticks patterns like Hammer, Bullish Englufing, Long Leged Doji or Dragonfly Doji, using stop loss 2 pips above the reversal candlestick & keep target equal to stop loss.
USD/CAD Selling Opportunity for Intraday Trading September 24, 2018
Sell near the resistance area 1.2945 and 1.2972 as soon as you get reversal candlesticks patterns like Shooting Star, Bearish Englufing, Long Leged Doji or Gravestone Doji, using stop loss 2 pips above the reversal candlestick & keep target equal to stop loss.
EUR/USD Technical Analysis September 24, 2018
GBP/USD Technical Analysis September 24, 2018
USD/JPY Technical Analysis September 24, 2018