
USD JPY Technical Analysis September 24, 2018
The USD rose 0.06% against the JPY on Friday and closed at 112.54. Today in the European session while USD JPY technical analysis September 24, 2018 is preparing at 8:15 GMT, the USD/JPY trading at 112.50, which is 0.03% higher against JPY from yesterday’s close.
In Asian session, data showed that the Japanese core consumer prices rose by 0.90% year-on-year in August 2018. Japan’s core inflation rate averaged 2.54% from 1971 to 2018, hit a record high of 24.70% in October 1974, and hit a record low of -2.40% in August 2009.
Japan’s inflation rate: In August 2018, Japan’s consumer price inflation rate rose from 0.9% in the previous month to 1.3%, higher than market expectations of 1.1%. This is the highest level since February due to rising food prices and rapid increases in transportation costs.
Japanese manufacturing PMI: The Nikkei Daily Economic Index rose from the last 52.5 in September 2018 to 52.9 in September 2018, a three-month high, compared with the market forecast of 53.1, lightning data shows. New orders grew faster, and new export orders rose for the first time since May.
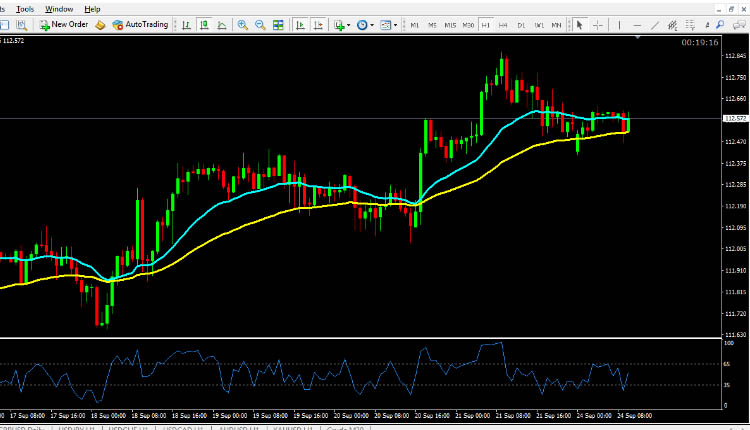
USD JPY technical analysis September 24, 2018
The pair is expected to find support at 112.35. And a fall through could take it to the next support level of 112.16. The pair is expected to find its first resistance at 112.80, and a rise through could take it to the next resistance level of 113.05. For today the expected trading range is between 111.00, Support and 112.26 Resistance.
The expected trend for today is Bullish
Supports Levels: Support 1: 112.35 Support 2: 112.16 Support 3: 112.90
Resistance Levels: Resistance 1: 112.80 Resistance 2: 113.05 Resistance 3: 113.25
Previous day`s high: 112.86
Previous day`s low: 112.41
USD/JPY Buying Opportunity for Intraday Trading September 24, 2018
Buy near the support area 112.35 and 112.16 as soon as you get reversal candlesticks patterns like Hammer, Bullish Englufing, Long Leged Doji or Dragonfly Doji, using stop loss 2 pips below the reversal candlestick & keep target equal to stop loss.
USD/JPY Selling Opportunity for Intraday Trading September 24, 2018
Sell near the resistance area 112.80 and 113.05 as soon as you get reversal candlesticks patterns like Shooting Star, Bearish Englufing, Long Leged Doji or Gravestone Doji, using stop loss 2 pips above the reversal candlestick & keep target equal to stop loss.
EUR/USD Technical Analysis September 24, 2018
GBP/USD Technical Analysis September 24, 2018
USD/CAD Technical Analysis September 24, 2018