
Gold Technical Analysis September 24, 2018
The Gold declined 0.65% against the USD on Friday and closed at 1199.00. Today in the European session while Gold technical analysis September 24, 2018 is preparing at 10:15 GMT, the XAU/USD trading at 1199.50, which is 0.04% higher from Yesterday’s close.
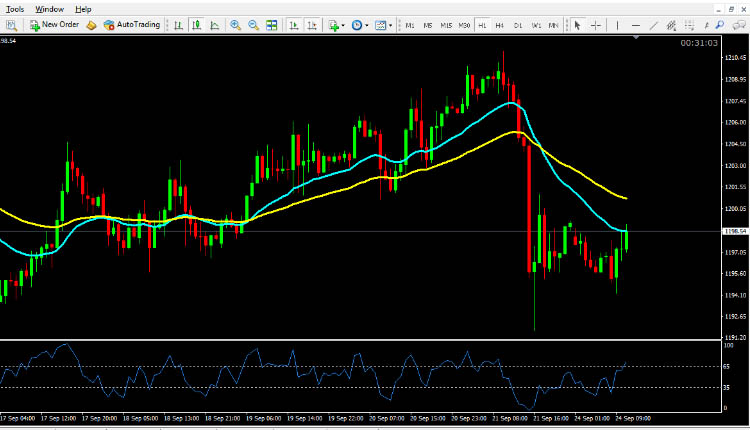
The gold market is very bearish on Friday’s trading session as it has risen to $1,200, which is already a major support level and extends to the $1,195 level. The market is highly synchronized with the US dollar and may trade in range fluctuations in the short term. If it falls below the important support line, it can be expected to be $1,180.
Gold technical analysis September 24 2018
The Gold is expected to find support at 1190.00, and a fall through could take it to the next support level of 1181.00. The pair is expected to find its first resistance at 1210.00, and a rise through could take it to the next resistance level of 1220.00. For today the expected trading range is betwee 1194.00, Support and 1211.00 Resistance.
The expected trend for today is Bearish
Supports Levels: Support 1: 1190.00 Support 2: 1181:00 b Support 3: 1172:00
Resistance Levels: Resistance 1: 1210.00 Resistance 2: 1220.00 Resistance 3: 1229.50
Previous day`s high: 1210.90
Previous day`s low: 1191:00
Gold Buying Opportunity for Intraday Trading September 24, 2018
Buy near the support area 1290.00 and 1181.00 as soon as you get reversal candlesticks patterns like Hammer, Bullish Englufing, Long Leged Doji or Dragonfly Doji, using stop loss 2 pips below the reversal candlestick & keep target equal to stop loss.
Gold Selling Opportunity for Intraday Trading September 24, 2018
Sell near the resistance area 1210.00 and 1220.00 as soon as you get reversal candlesticks patterns like Shooting Star, Bearish Englufing, Long Leged Doji or Gravestone Doji, using stop loss 2 pips above the reversal candlestick & keep target equal to stop loss.