
Gold Technical Analysis September 3, 2018
The Gold rose 0.03% against the USD on Friday and closed at 1200.80. Today in the European session while Gold technical analysis September 3, 2018 is preparing at 7:45 GMT, the XAU/USD trading at 1201.50, which is 0.05% higher from Friday’s close.
Gold is expected to see a steady decline in the forex market in September as the dollar is expected to rise throughout the month and two of the major news investors will focus on in the near future are the US NFP data and the Federal Reserve Rate Decision for September 2018. Both markets have turned positive to the US dollar. The gold market may see a steady bearish trend with the possibility of breaking the current low levels in 2018.
Gold technical analysis September 3, 2018
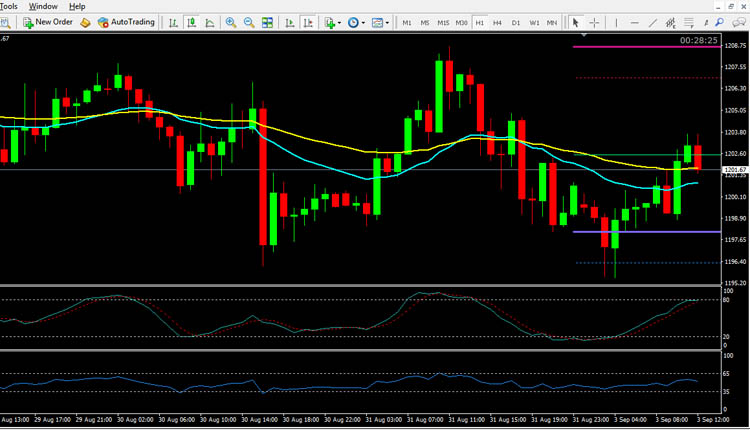
The Gold is expected to find support at 1196.00, and a fall through could take it to the next support level of 1192.00. The pair is expected to find its first resistance at 1184.00, and a rise through could take it to the next resistance level of 1193.50. For today the expected trading range is betwee 1160.00, Support and 1193.50 Resistance.
The expected trend for today is Bearish
Supports Levels: Support 1: 1196.00 Support 2: 1192:00 Support 3: 1186:00
Resistance Levels: Resistance 1: 1207.00 Resistance 2: 1113.00 Resistance 3: 1217.50
Previous day`s high: 1208.50
Previous day`s low: 1198:00
Gold Buying Opportunity for Intraday Trading September 3, 2018
Buy near the support area 1196.00 and 1192.00 as soon as you get reversal candlesticks patterns like Hammer, Bullish Englufing, Long Leged Doji or Dragonfly Doji.
Gold Selling Opportunity for Intraday Trading September 3, 2018
Sell near the resistance area 1107.00 and 1113.00 as soon as you get reversal candlesticks patterns like Shooting Star, Bearish Englufing, Long Leged Doji or Gravestone Doji.
EUR/USD Technical Analysis September 3, 2018
GBP/USD Technical Analysis September 3, 2018
USD/JPY Technical Analysis September 3, 2018