
GBP USD Technical Analysis September 3, 2018
The GBP declined 0.37% against the USD on Friday and closed at 1.2957. Today in the Asian session while preparing GBP USD technical analysis September 3, 2018 at 8:15 GMT, the GBP/USD is trading at 1.2920, which is 0.28% lower against the USD from yesterday’s close.
In Europe, data showed that The UK’s main consumer confidence index, compiled by the European Commission’s market research firm GfK, rose to -7 in August from -10 in July, following the 2018 highs that jumped in March and May.
When the European market opens, the economic data will release,United Kingdom Manufacturing PMI: The IHS Markit / CIPS manufacturing PMI in the UK fell to a three-month low of 54 in July 2018 from a revised 54.5 in the previous month and below market expectations at 54.2. Production growth fell to a 16-month low and new orders have risen at least since June 2017 despite a rebound in new export business.
GBP USD technical analysis September 3, 2018
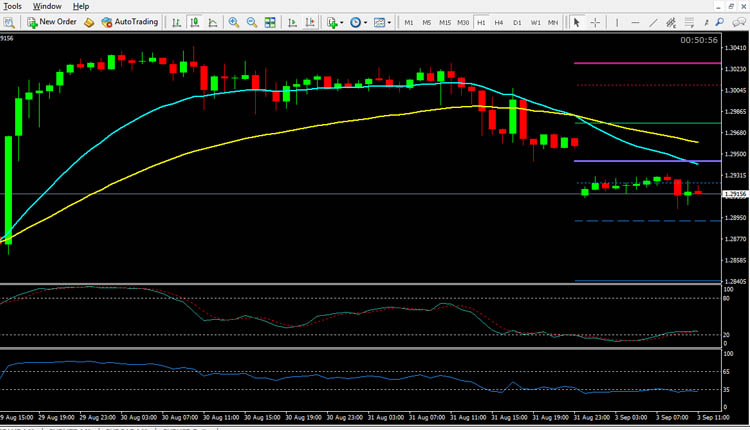
The pair is expected to find support at 1.2890, and a fall through could take it to the next support level of 1.2840. The pair is expected to find its first resistance at 1.3000, and a rise through could take it to the next resistance level of 1.3060. For today the expected trading range is between 1.2840, Support and 1.3000 Resistance.
The expected trend for today is Bearish
Supports Levels: Support 1: 1.2925 Support 2: 1.2890 Support 3: 1.2840
Resistance Levels: Resistance 1: 1.3000 Resistance 2: 1.3060 Resistance 3: 1.3090
Previous day`s high: 1.3038
Previous day`s low: 1.2944
GBP/USD Buying Opportunity for Intraday Trading September 3, 2018
Buy near the support area 1.2890 and 1.2840 as soon as you get reversal candlesticks patterns like Hammer, Bullish Englufing, Long Leged Doji or Dragonfly Doji
EUR/USD Selling Opportunity for Intraday Trading September 3, 2018
Sell near the resistance area 1.3000 and 1.3060 as soon as you get reversal candlesticks patterns like Shooting Star, Bearish Englufing, Long Leged Doji or Gravestone Doji