
USD JPY Technical Analysis September 3, 2018
The USD rose 0.11% against the JPY on Friday and closed at 111.09. Today in the European session while USD JPY technical analysis September 3, 2018 is preparing at 8:45 GMT, the USD/JPY trading at 111.00, which is 0.08% lower against JPY from yesterday’s close.
In Japan, data showed that the Japan’s unemployment rate rose to 2.5 percent in July of 2018 from 2.4 percent in the previous month and slightly above market estimates by 2.4 percent. The highest rate since April
Industrial production in Japan rose 2.30% in July of 2018 compared with the same month last year. Japan’s industrial production averaged 5.09 per cent from 1954 to 2018, reaching an all-time high of 30 per cent in February 1960 and a record low of 37.18 per cent in February 2009.
Japan’s home prices fell 0.7 percent year-on-year in July of 2018, well below market expectations of a 3.8 percent drop after a 7.1 percent drop in the previous month.
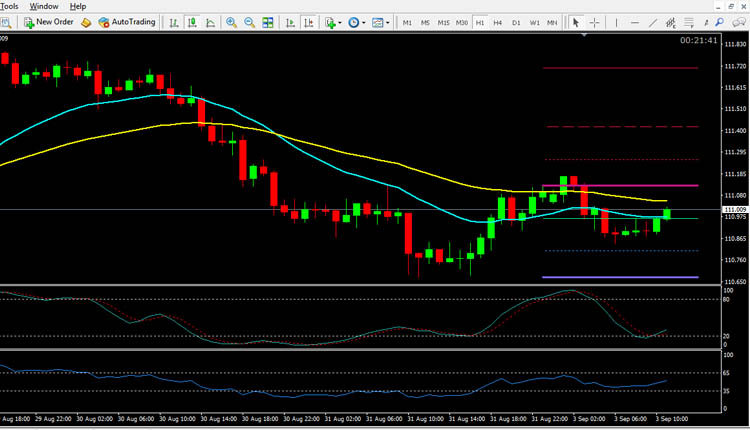
USD JPY technical analysis September 3, 2018
The pair is expected to find support at 110.80. And a fall through could take it to the next support level of 100.50. The pair is expected to find its first resistance at 111.25, and a rise through could take it to the next resistance level of 111.40. For today the expected trading range is between 110.50, Support and 111.25 Resistance.
The expected trend for today is Bullish
Supports Levels: Support 1: 110.80 Support 2: 110.50 Support 3: 110.35
Resistance Levels: Resistance 1: 111.25 Resistance 2: 111,40 Resistance 3: 111.71
Previous day`s high: 111.12
Previous day`s low: 110.67
USD/JPY Buying Opportunity for Intraday Trading September 3, 2018
Buy near the support area 110.80 and 110.50 as soon as you get reversal candlesticks patterns like Hammer, Bullish Englufing, Long Leged Doji or Dragonfly Doji
USD/JPY Selling Opportunity for Intraday Trading September 3, 2018
Sell near the resistance area 111.25 and 111.40 as soon as you get reversal candlesticks patterns like Shooting Star, Bearish Englufing, Long Leged Doji or Gravestone Doji