
Crude Oil Technical Analysis September 19, 2018
The Crude Oil rose 1.26% against the USD on Tuesday and closed at 69.39. Today in the European session while crude oil technical analysis September 19, 2018 is preparing at 10:45 GMT, the Crude Oil trading at 69.50, which is 0.15% higher from Yesterday’s close.
Crude oil prices have risen in recent months as investors expect the US to impose sanctions on Iran. The sanctions are expected to take effect on November 4, which has led to a decline in Iran’s crude oil exports. Investors are also looking forward to the Energy Information Administration’s weekly crude oil inventories, which will be announced later in the meeting.
Crude Oil technical analysis September 19 2018
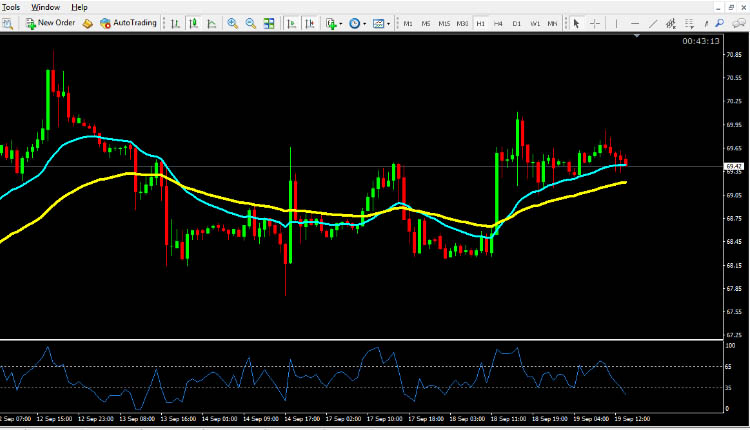
The pair is expected to find support at 68.38 and a fall through could take it to the next support level of 67.38. The pair is expected to find its first resistance at 70.25, and a rise through could take it to the next resistance level of 71.12. For today the expected trading range is between 68.38, Support and 70.25 Resistance.
The expected trend for today is Bullish
Supports Levels: Support 1: 68.38 Support 2: 67.38 Support 3: 66.50
Resistance Levels: Resistance 1: 70.25 Resistance 2: 71.12 Resistance 3: 72.12
Previous day`s high: 70.11
Previous day`s low: 68.22
Crude Oil Buying Opportunity for Intraday Trading September 19, 2018
Buy near the support area 68.38 and 67.38 as soon as you get reversal candlesticks patterns like Hammer, Bullish Englufing, Long Leged Doji or Dragonfly Doji, using stop loss 2 pips below the reversal candlestick & keep target equal to stop loss.
Crude Oil Selling Opportunity for Intraday Trading September 19, 2018
Sell near the resistance area 70.25 and 71.12 as soon as you get reversal candlesticks patterns like Shooting Star, Bearish Englufing, Long Leged Doji or Gravestone Doji, using stop loss 2 pips above the reversal candlestick & keep target equal to stop loss.