
Gold Technical Analysis September 4, 2018
The Gold rose 0.05% against the USD on Friday and closed at 1200.80. Today in the European session while Gold technical analysis September 4, 2018 is preparing at 10:45 GMT, the XAU/USD trading at 1195.50, which is 0.44% lower from Yesterday’s close.
Gold prices fell at the start of Asian trading hours as the dollar hit a one-week high on rising global trade tensions and economic worries in emerging markets. The yellow metal has fallen 8% this year amid rising US interest rates. Trade disputes and the Turkish currency crisis as investors put their money in dollars. Which is seen as a safe haven. Spot gold fell by 0.44% to $ 1,194.50 an ounce as of this writing. The economic crisis in emerging markets makes the currencies very weak and takes advantage of the dollar that continues to put pressure on gold. The currencies have suffered in recent weeks including the Argentine peso, the Turkish lira, the South African rand, the Brazilian riyal, the Indonesian rupee and the Indian rupee.
Gold technical analysis September 4, 2018
The Gold is expected to find support at 1192.00, and a fall through could take it to the next support level of 1188.00. The pair is expected to find its first resistance at 1184.00, and a rise through could take it to the next resistance level of 1193.50. For today the expected trading range is betwee 1160.00, Support and 1193.50 Resistance.
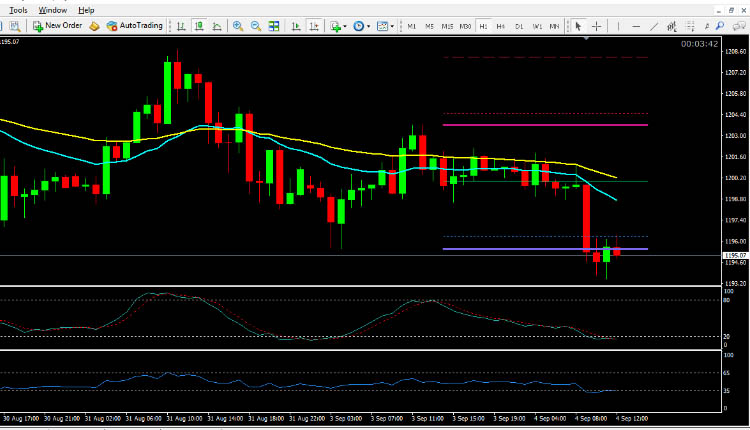
The expected trend for today is Bearish
Supports Levels: Support 1: 1196.00 Support 2: 1192:00 Support 3: 1188:00
Resistance Levels: Resistance 1: 1204.50 Resistance 2: 1208.00 Resistance 3: 1212.50
Previous day`s high: 1203.70
Previous day`s low: 1195:50
Gold Buying Opportunity for Intraday Trading September 4, 2018
Buy near the support area 1192.00 and 1188.00 as soon as you get reversal candlesticks patterns like Hammer, Bullish Englufing, Long Leged Doji or Dragonfly Doji.
Gold Selling Opportunity for Intraday Trading September 4, 2018
Sell near the resistance area 1204.50 and 1208.00 as soon as you get reversal candlesticks patterns like Shooting Star, Bearish Englufing, Long Leged Doji or Gravestone Doji.