
Crude Oil Technical Analysis September 4, 2018
The Crude Oil rose 0.35% against the USD on Friday and closed at 69.86. Today in the European session while crude oil technical analysis September 4, 2018 is preparing at 10:45 GMT, the Crude Oil trading at 70.40, which is 0.62% higher from Yesterday’s close.
Oil prices rose sharply on Tuesday after the Gulf of Mexico oil platforms were released in preparation for a hurricane. Global oil markets have seen a decline in the past month, pushing Brent prices up more than 10 percent since mid-August. Investors expect a drop in supply from Iran as US sanctions against Tehran begin.
Producers resist temptations and exercise capital discipline. OPEC and Russia convinced market participants that they manage supplies of more than half of world production. The United States is using sanctions more effectively, and many of OPEC’s major producers are at risk of failed states.
Crude Oil technical analysis September 4 2018
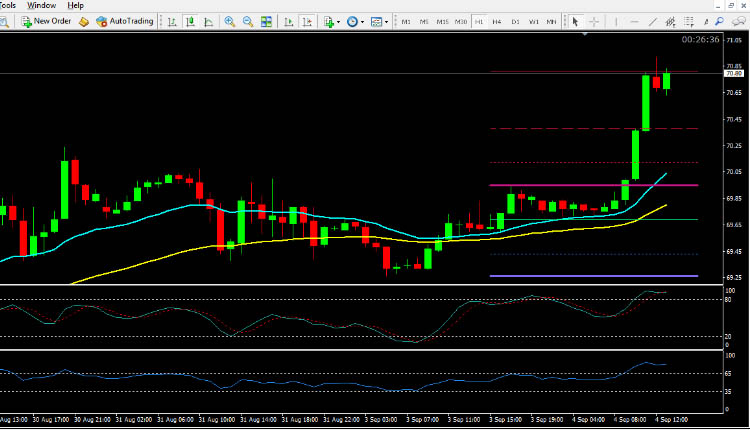
The pair is expected to find support at 69.43 and a fall through could take it to the next support level of 69.00. The pair is expected to find its first resistance at 70.38, and a rise through could take it to the next resistance level of 70.81. For today the expected trading range is between 69.43, Support and 70.81 Resistance.
The expected trend for today is Bullish
Supports Levels: Support 1: 69.43 Support 2: 69.00 Support 3: 68.75
Resistance Levels: Resistance 1: 70.12 Resistance 2: 70.38 Resistance 3: 70.81
Previous day`s high: 70.07
Previous day`s low: 69.38
Crude Oil Buying Opportunity for Intraday Trading September 4, 2018
Buy near the support area 69.43 and 69.00 as soon as you get reversal candlesticks patterns like Hammer, Bullish Englufing, Long Leged Doji or Dragonfly Doji.
Crude Oil Selling Opportunity for Intraday Trading September 4, 2018
Sell near the resistance area 70.38 and 70.81 as soon as you get reversal candlesticks patterns like Shooting Star, Bearish Englufing, Long Leged Doji or Gravestone Doji.