
GBP USD Technical Analysis September 25, 2018
The GBP declined 0.03% against the USD on Monday and closed at 1.3118. Today in the Asian session while preparing GBP USD technical analysis September 25, 2018 at 10:15 GMT, the GBP/USD is trading at 1.3150, which is 0.24% higher against the USD from yesterday’s close.
In European session, data showed that the monthly industrial order balance of the Confederation of British Industry fell to a four-month low of -1 from +7 in the previous month in September 2018, and the market expectation was +5. Export orders fell to their lowest level since October 2017 (August +5 + 9), while output expectations for the next three months remained strong (+19 vs. +20).
UK retail sales growth year-on-year: UK retail sales rose 3.3% year-on-year, following a 3.8% increase in July and easily exceeded market expectations of 2.3%.
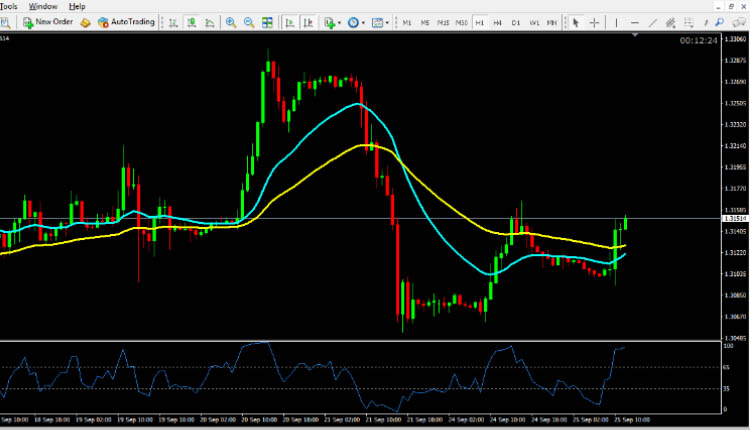
GBP USD technical analysis September 25, 2018
The pair is expected to find support at 1.3065, and a fall through could take it to the next support level of 1.3012 The pair is expected to find its first resistance at 1.3170, and a rise through could take it to the next resistance level of 1.3220. For today the expected trading range is between 1.3065, Support and 1.3220 Resistance.
The expected trend for today is Bullish
Supports Levels: Support 1: 1.3065 Support 2: 1.3012 Support 3: 1.2960
Resistance Levels: Resistance 1: 1.3170 Resistance 2: 1.3220 Resistance 3: 1.3442
Previous day`s high: 1.3165
Previous day`s low: 1.3062
GBP/USD Buying Opportunity for Intraday Trading September 25, 2018
Buy near the support area 1.3065 and 1.3012 as soon as you get reversal candlesticks patterns like Hammer, Bullish Englufing, Long Leged Doji or Dragonfly Doji, using stop loss 2 pips below the reversal candlestick & keep target equal to stop loss.
EUR/USD Selling Opportunity for Intraday Trading September 25, 2018
Sell near the resistance area 1.3170 and 1.3220 as soon as you get reversal candlesticks patterns like Shooting Star, Bearish Englufing, Long Leged Doji or Gravestone Doji, using stop loss 2 pips above the reversal candlestick & keep target equal to stop loss.
EUR/USD Technical Analysis September 25, 2018
USD/JPY Technical Analysis September 25, 2018
USD/CAD Technical Analysis September 25, 2018