
EUR USD Technical Analysis September 25, 2018
The EUR declined 0.01% against the USD on Monday and closed at 1.1756. Today in the European session while EUR USD technical analysis September 25, 2018 is preparing at 10:15 GMT, the pair is trading at 1.1750, which is 0.05% lower from yesterday’s closed.
In European session, data showed that the a survey on Monday showed that German business morale deteriorated slightly less than expected in September, suggesting that company executives are less confident about the growth prospects of Europe’s largest economy. The Munich-based Ifo Institute of Economics said its business climate index fell to 103.7 after 103.9 revised last month.
EUR USD technical analysis September 25, 2018
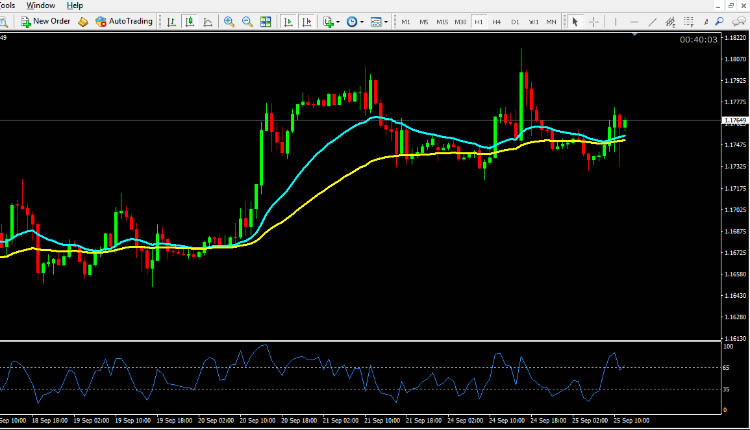
The pair is expected to find support at 1.1708 and a fall through could take it to the next support level of 1.1670. The pair is expected to find its first resistance at 1.1800, and a rise through could take it to the next resistance level of 1.1852. For today the expected trading range is between 1.1670, Support and 1.1800 Resistance.
The expected trend for today is Bullish
Supports Levels: Support 1: 1.1708, Support 2: 1.1670, Support 3: 1.1617
Resistance Levels: Resistance 1: 1.1800, Resistance 2: 1.1852, Resistance 3: 1.1890
Previous day`s high: 1.1814
Previous day`s low: 1.1723
EUR/USD Buying Opportunity for Intraday Trading September 25, 2018
Buy near the support area 1.1708 and 1.1670 as soon as you get reversal candlesticks patterns like Hammer, Bullish Englufing, Long Leged Doji or Dragonfly Doji, using stop loss 2 pips below the reversal candlestick & keep target equal to stop loss.
EUR/USD Selling Opportunity for Intraday Trading September 25, 2018
Sell near the resistance area 1.1800 and 1.1852 as soon as you get reversal candlesticks patterns like Shooting Star, Bearish Englufing, Long Leged Doji or Gravestone Doji, using stop loss 2 pips above the reversal candlestick & keep target equal to stop loss.
GBP/USD Technical Analysis September 25, 2018
USD/JPY Technical Analysis September 25, 2018
USD/CAD Technical Analysis September 25, 2018