
Gold Technical Analysis September 28, 2018
The Gold declined 0.10% against the USD on Thursday and closed at 1182.47. Today in the European session while Gold technical analysis September 28, 2018 is preparing at 10:15 GMT, the XAU/USD trading at 1182.90, which is 0.03% higher from Yesterday’s close.
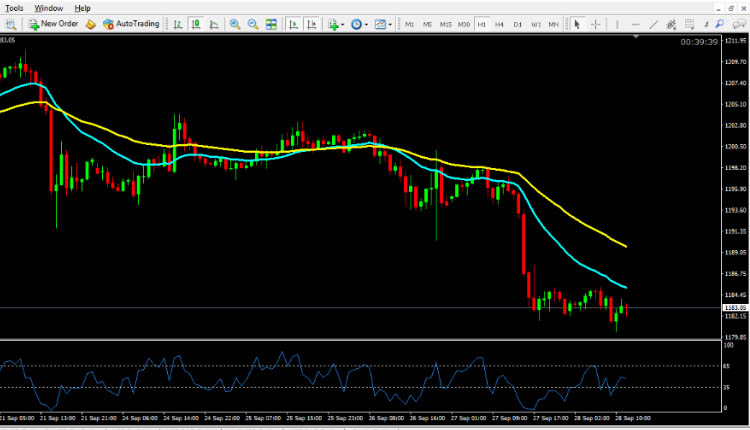
Gold prices steadily fell on Friday morning due to relatively low volume. The fundamentals are bearish, but technical oversold conditions may help limit losses. Gold is currently at its lowest level since August 17.
On Wednesday, the Fed raised its benchmark interest rate by 25 basis points. In addition, the economic outlook is bullish, and it indicates that interest rates will rise again in December, and may raise interest rates three more times in 2019.
Gold technical analysis September 28 2018
The Gold is expected to find support at 1176.50, and a fall through could take it to the next support level of 1171.00. The pair is expected to find its first resistance at 1193.50, and a rise through could take it to the next resistance level of 1204.50. For today the expected trading range is betwee 1171.00, Support and 1193.50 Resistance.
The expected trend for today is Bearish
Supports Levels: Support 1: 1176.50 Support 2: 1171:00 Support 3: 1160:00
Resistance Levels: Resistance 1: 1193.50 Resistance 2: 1204.50 Resistance 3: 1210.00
Previous day`s high: 1198.40
Previous day`s low: 1181:60
Gold Buying Opportunity for Intraday Trading September 28, 2018
Buy near the support area 1276.50 and 1171.00 as soon as you get reversal candlesticks patterns like Hammer, Bullish Englufing, Long Leged Doji or Dragonfly Doji, using stop loss 2 pips below the reversal candlestick & keep target equal to stop loss.
Gold Selling Opportunity for Intraday Trading September 28, 2018
Sell near the resistance area 1193.50 and 1204.50 as soon as you get reversal candlesticks patterns like Shooting Star, Bearish Englufing, Long Leged Doji or Gravestone Doji, using stop loss 2 pips above the reversal candlestick & keep target equal to stop loss.