
Gold Technical Analysis September 25, 2018
The Gold rose 0.04% against the USD on Monday and closed at 1198.60. Today in the European session while Gold technical analysis September 25, 2018 is preparing at 10:15 GMT, the XAU/USD trading at 1200.00, which is 0.11% higher from Yesterday’s close.
Gold futures closed higher on Monday, recovering some of the recent losses as investors waited for the Federal Reserve’s general expectation of a third rate hike in 2018 this week – a good survey of the market. However, despite the downgrade, analysts are still optimistic that prices will eventually rise.
Gold technical analysis September 25 2018
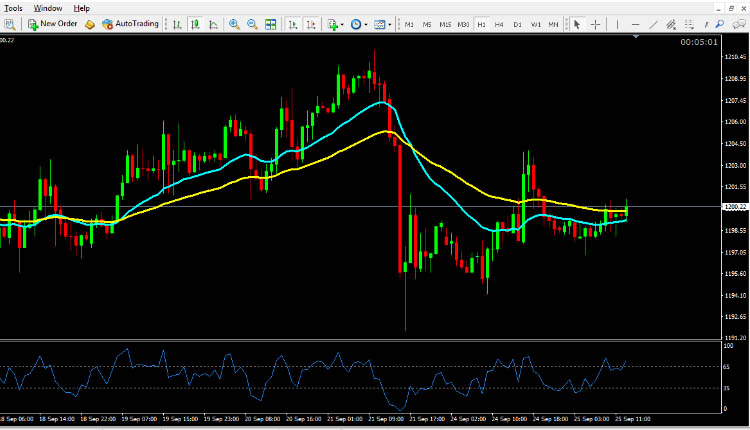
The Gold is expected to find support at 1194.00, and a fall through could take it to the next support level of 1189.00. The pair is expected to find its first resistance at 1204.00, and a rise through could take it to the next resistance level of 1209.00. For today the expected trading range is betwee 1189.00, Support and 1213.50 Resistance.
The expected trend for today is Bullish
Supports Levels: Support 1: 1194.00 Support 2: 1189:00 Support 3: 1184:00
Resistance Levels: Resistance 1: 1204.00 Resistance 2: 1209.00 Resistance 3: 1213.50
Previous day`s high: 1210.90
Previous day`s low: 1191:00
Gold Buying Opportunity for Intraday Trading September 25, 2018
Buy near the support area 1294.00 and 1189.00 as soon as you get reversal candlesticks patterns like Hammer, Bullish Englufing, Long Leged Doji or Dragonfly Doji, using stop loss 2 pips below the reversal candlestick & keep target equal to stop loss.
Gold Selling Opportunity for Intraday Trading September 25, 2018
Sell near the resistance area 1204.00 and 1209.00 as soon as you get reversal candlesticks patterns like Shooting Star, Bearish Englufing, Long Leged Doji or Gravestone Doji, using stop loss 2 pips above the reversal candlestick & keep target equal to stop loss.