
Gold Technical Analysis September 21, 2018
The Gold rose 0.33% against the USD on Thursday and closed at 1207.70. Today in the European session while Gold technical analysis September 21, 2018 is preparing at 10:15 GMT, the XAU/USD trading at 1207.00, which is 0.06% lower from Yesterday’s close.
Gold futures fell shortly before the opening day of the regular trading day after buyers failed to attempt to break through the key retracement resistance levels. The weak dollar has pushed the market to support earlier, but rising US Treasury yields and expectations of a Fed rate hike next week will help limit gains.
Gold technical analysis September 21 2018
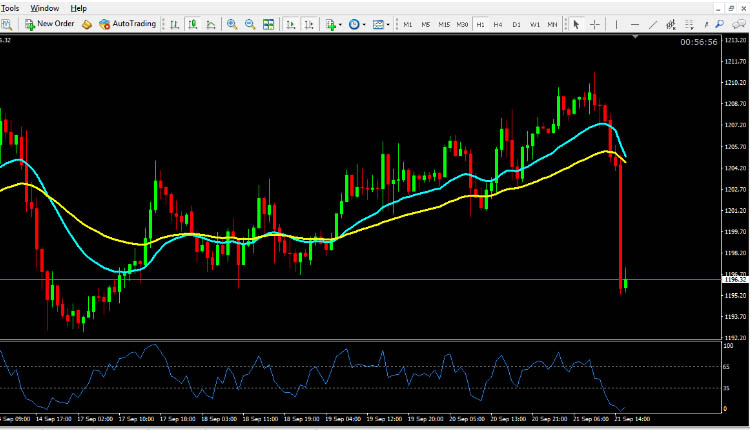
The Gold is expected to find support at 1202.00, and a fall through could take it to the next support level of 1198.00. The pair is expected to find its first resistance at 1210.00, and a rise through could take it to the next resistance level of 1213.00. For today the expected trading range is betwee 1194.00, Support and 1211.00 Resistance.
The expected trend for today is Bearish
Supports Levels: Support 1: 1102.00 Support 2: 1198:00 b Support 3: 1194:00
Resistance Levels: Resistance 1: 1210.00 Resistance 2: 1213.00 Resistance 3: 1217.50
Previous day`s high: 1208.30
Previous day`s low: 1200:75
Gold Buying Opportunity for Intraday Trading September 21, 2018
Buy near the support area 1202.00 and 1198.00 as soon as you get reversal candlesticks patterns like Hammer, Bullish Englufing, Long Leged Doji or Dragonfly Doji, using stop loss 2 pips below the reversal candlestick & keep target equal to stop loss.
Gold Selling Opportunity for Intraday Trading September 21, 2018
Sell near the resistance area 1210.00 and 1213.00 as soon as you get reversal candlesticks patterns like Shooting Star, Bearish Englufing, Long Leged Doji or Gravestone Doji, using stop loss 2 pips above the reversal candlestick & keep target equal to stop loss.