
Gold Technical Analysis September 20, 2018
The Gold drose 0.49% against the USD on Wednesday and closed at 1203.60. Today in the European session while Gold technical analysis September 20, 2018 is preparing at 10:15 GMT, the XAU/USD trading at 1203.00, which is 0.05% lower from Yesterday’s close.
As the US-China trade dispute escalates and US interest rates rise is considered a catalyst for gold selling, the precious metals have fallen about 11.5% from their April high. Reports that the US and China’s tariff levels on each other’s goods are lower than expected are considered to be the headwind of the dollar price, and the dollar price is considered a safe-haven asset. The report said that the dollar is also under pressure. The United States and Canada are unlikely to reach an agreement on the North American Free Trade Agreement this week.
Gold technical analysis September 20, 2018
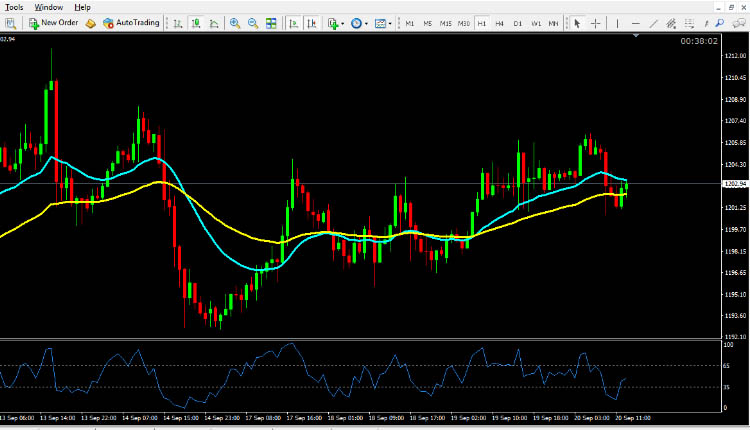
The Gold is expected to find support at 1198.00, and a fall through could take it to the next support level of 1194.00. The pair is expected to find its first resistance at 1207.00, and a rise through could take it to the next resistance level of 1211.00. For today the expected trading range is betwee 1194.00, Support and 1211.00 Resistance.
The expected trend for today is Bullish
Supports Levels: Support 1: 1198.00 Support 2: 1194:00 b Support 3: 1190:00
Resistance Levels: Resistance 1: 1207.00 Resistance 2: 1211.00 Resistance 3: 1216.00
Previous day`s high: 1204.60
Previous day`s low: 1192:60
Gold Buying Opportunity for Intraday Trading September 20, 2018
Buy near the support area 1198.00 and 1194.00 as soon as you get reversal candlesticks patterns like Hammer, Bullish Englufing, Long Leged Doji or Dragonfly Doji, using stop loss 2 pips below the reversal candlestick & keep target equal to stop loss.
Gold Selling Opportunity for Intraday Trading September 20, 2018
Sell near the resistance area 1207.00 and 1211.00 as soon as you get reversal candlesticks patterns like Shooting Star, Bearish Englufing, Long Leged Doji or Gravestone Doji, using stop loss 2 pips above the reversal candlestick & keep target equal to stop loss.