
Gold Technical Analysis September 18, 2018
The Gold rose 0.59% against the USD on Friday and closed at 1200.88. Today in the European session while Gold technical analysis September 18, 2018 is preparing at 10:15 GMT, the XAU/USD trading at 1197.50, which is 0.28% lower from Yesterday’s close.
Gold prices fell on Tuesday, fearing that global trade slowed after the US imposed a new round of tariffs on Chinese imports, and investors sought dollar security. Gold faces a variety of negative headwinds, such as the escalation of trade conflicts and raising US interest rates, reducing the demand for interest-free gold bars. In the next few weeks, this may be a very difficult environment for gold because it is fighting these two aspects.
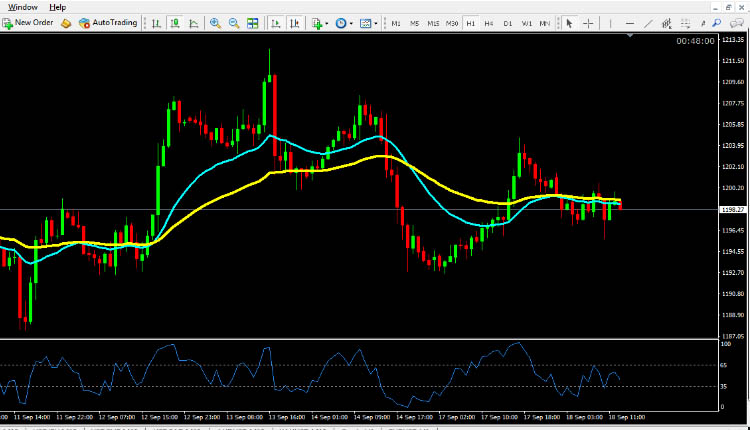
Gold technical analysis September 18, 2018
The Gold is expected to find support at 1194.00, and a fall through could take it to the next support level of 1187.00. The pair is expected to find its first resistance at 1206.00, and a rise through could take it to the next resistance level of 1211.50. For today the expected trading range is betwee 1160.00, Support and 1193.50 Resistance.
The expected trend for today is Bearish
Supports Levels: Support 1: 1194.00 Support 2: 1187:00 b Support 3: 1182:00
Resistance Levels: Resistance 1: 1206.00 Resistance 2: 1211.50 Resistance 3: 1218.00
Previous day`s high: 1204.60
Previous day`s low: 1192:60
Gold Buying Opportunity for Intraday Trading September 18, 2018
Buy near the support area 1194.00 and 1187.00 as soon as you get reversal candlesticks patterns like Hammer, Bullish Englufing, Long Leged Doji or Dragonfly Doji, using stop loss 2 pips below the reversal candlestick & keep target equal to stop loss.
Gold Selling Opportunity for Intraday Trading September 18, 2018
Sell near the resistance area 1206.00 and 1211.50 as soon as you get reversal candlesticks patterns like Shooting Star, Bearish Englufing, Long Leged Doji or Gravestone Doji, using stop loss 2 pips above the reversal candlestick & keep target equal to stop loss.