Gold Technical Analysis October 1, 2018
The Gold rose 0.73% against the USD on Friday and closed at 1191.45. Today in the European session while Gold technical analysis October 1, 2018 is preparing at 10:15 GMT, the XAU/USD trading at 1185.00, which is 0.55% lower from Yesterday’s close.
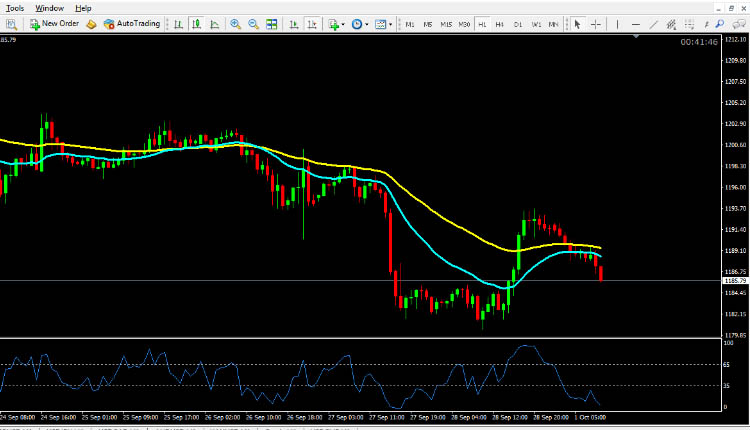
The price of gold rose during the trading hours on Friday and rose by $7 during the session. There is a lot of resistance at the level of $1,195, and as the dollar continues to strengthen, the market is hard to cross the high. The level below $1,185 is very significant and is unlikely to fall below that level.
Gold technical analysis October 1 2018
The Gold is expected to find support at 1183.00, and a fall through could take it to the next support level of 1175.00. The pair is expected to find its first resistance at 1196.50, and a rise through could take it to the next resistance level of 1201.50. For today the expected trading range is betwee 1170.00, Support and 1196.50 Resistance.
The expected trend for today is Bearish
Supports Levels: Support 1: 1183.00 Support 2: 1175:00 Support 3: 1170:00
Resistance Levels: Resistance 1: 1196.50 Resistance 2: 1201.50 Resistance 3: 1210.00
Previous day`s high: 1193.65
Previous day`s low: 1180:50
Gold Buying Opportunity for Intraday Trading October 1, 2018
Buy near the support area 1283.00 and 1175.00 as soon as you get reversal candlesticks patterns like Hammer, Bullish Englufing, Long Leged Doji or Dragonfly Doji, using stop loss 2 pips below the reversal candlestick & keep target equal to stop loss.
Gold Selling Opportunity for Intraday Trading October 1, 2018
Sell near the resistance area 1196.50 and 1201.50 as soon as you get reversal candlesticks patterns like Shooting Star, Bearish Englufing, Long Leged Doji or Gravestone Doji, using stop loss 2 pips above the reversal candlestick & keep target equal to stop loss.