
GBP USD Technical Analysis September 4, 2018
The GBP declined 0.36% against the USD on Monday and closed at 1.2867. Today in the Asian session while preparing GBP USD technical analysis September 4, 2018 at 7:15 GMT, the GBP/USD is trading at 1.2850, which is 0.13% lower against the USD from yesterday’s close.
In Europe, data showed that Manufacturing PMI from IHS Markit / CIPS in the UK fell to 52.8 in August 2018 from 53.8 in the previous month to fall. Which wad below market expectations at 53.8. The reading marked the weakest pace of expansion in the manufacturing sector since July 2016. With output rising at least in 17 months and slowing, new demand growth to its slowest pace during its 25-month run as foreign demand plummeted for the first time. In addition, the pace of job creation fell into quasi-recession and optimism fell to a 22-month low. On the price front, inflationary pressures remained relatively strong.
When the US market opens, the economic data will release such as United Kingdom Construction, PMI: The Purchasing Managers Index rose to 55.8 in July 2018 from 53.1 in the previous month, easily outperforming the market forecast at 52.8. The latest reading pointed to the strongest pace of expansion in the construction sector since May 2017 as residential and commercial companies grew at the fastest pace in more than two and a half years. In addition, civil engineering activity increased more sharply than in June. New orders in the construction sector have risen more than others since May 2017, contributing to the biggest rise in employment since December 2015.
UK interest rate:
The Bank of England unanimously voted to raise the bank’s interest rate by 25 basis points to 0.75% on August 2, saying recent data confirm that the first-quarter production was temporary and that the labor market continued to narrow and wage growth was narrow. The Bank also stressed that continued tightening of monetary policy during the forecast period would be appropriate to return inflation to a sustainable target of 2%.
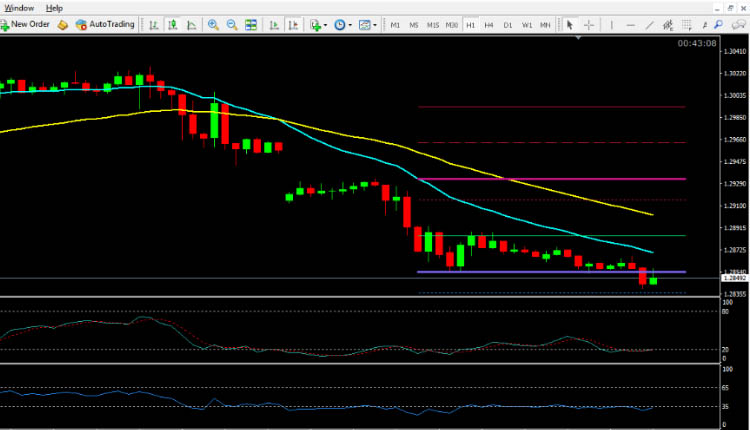
GBP USD technical analysis September 4, 2018
The pair is expected to find support at 1.2836, and a fall through could take it to the next support level of 1.2805. The pair is expected to find its first resistance at 1.2915, and a rise through could take it to the next resistance level of 1.2963. For today the expected trading range is between 1.2677, Support and 1.2783 Resistance.
The expected trend for today is Bearish
Supports Levels: Support 1: 1.2836 Support 2: 1.2805 Support 3: 1.2758
Resistance Levels: Resistance 1: 1.2915 Resistance 2: 1.1963 Resistance 3: 1.2993
Previous day`s high: 1.2932
Previous day`s low: 1.2854
GBP/USD Buying Opportunity for Intraday Trading September 4, 2018
Buy near the support area 1.2836 and 1.2805 as soon as you get reversal candlesticks patterns like Hammer, Bullish Englufing, Long Leged Doji or Dragonfly Doji
EUR/USD Selling Opportunity for Intraday Trading September 4, 2018
Sell near the resistance area 1.2915 and 1.2963 as soon as you get reversal candlesticks patterns like Shooting Star, Bearish Englufing, Long Leged Doji or Gravestone Doji.