
GBP USD Technical Analysis September 26, 2018
The GBP rose 0.45% against the USD on Tuesday and closed at 1.3178. Today in the Asian session while preparing GBP USD technical analysis September 26, 2018 at 10:15 GMT, the GBP/USD is trading at 1.3165, which is 0.10% lower against the USD from yesterday’s close.
When the US market opens, the economic data will release, according to the UK Financial and Trade Association, Bank of England approved 39,584 new homes in July 2018 to purchase mortgage loans, down from 40,330 loans revised down in June, down 4.3% year-on-year. The figure is below market expectations of 40,600, although it needs to be re-adjusted before the Bank of England is expected to raise interest rates.
GBP USD Technical Analysis September 26, 2018
GBP USD Technical Analysis September 26, 2018
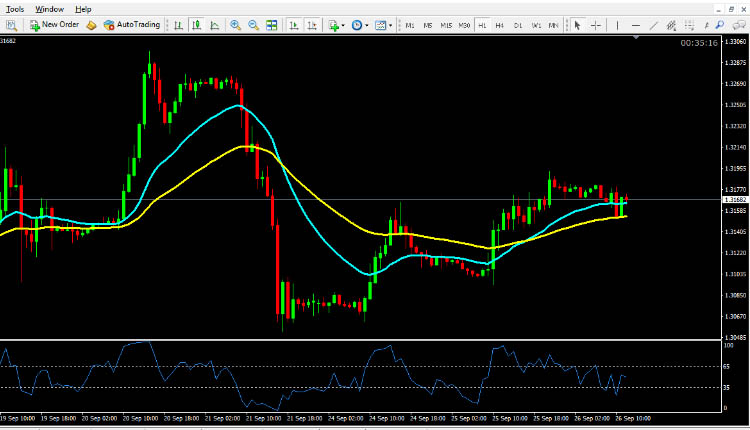
The pair is expected to find support at 1.3118, and a fall through could take it to the next support level of 1.3057 The pair is expected to find its first resistance at 1.3217, and a rise through could take it to the next resistance level of 1.3254. For today the expected trading range is between 1.3118, Support and 1.3217 Resistance.
The expected trend for today is Bearish
Supports Levels: Support 1: 1.3118 Support 2: 1.3057 Support 3: 1.3020
Resistance Levels: Resistance 1: 1.3217 Resistance 2: 1.3254 Resistance 3: 1.3315
Previous day`s high: 1.3165
Previous day`s low: 1.3062
GBP/USD Buying Opportunity for Intraday Trading September 26, 2018
Buy near the support area 1.3118 and 1.3057 as soon as you get reversal candlesticks patterns like Hammer, Bullish Englufing, Long Leged Doji or Dragonfly Doji, using stop loss 2 pips below the reversal candlestick & keep target equal to stop loss.
EUR/USD Selling Opportunity for Intraday Trading September 26, 2018
Sell near the resistance area 1.3217 and 1.3254 as soon as you get reversal candlesticks patterns like Shooting Star, Bearish Englufing, Long Leged Doji or Gravestone Doji, using stop loss 2 pips above the reversal candlestick & keep target equal to stop loss.
EUR/USD Technical Analysis September 26, 2018
USD/JPY Technical Analysis September 26, 2018
USD/CAD Technical Analysis September 26, 2018