
GBP USD Technical Analysis September 21, 2018
The GBP rose 0.92% against the USD on Thursday and closed at 1.3263. Today in the European session while preparing GBP USD technical analysis September 21, 2018 at 9:45 GMT, the GBP/USD is trading at 1.3210, which is 0.40% hlower against the USD from yesterday’s close.
In European session, data showed that the After an upward revision of 0.9% in July, retail sales in the UK increased by 0.3% from a month in August 2018 and easily exceeded market expectations by 0.2%. Strong sales growth in other non-food (2.8%) and household goods stores (4.5%) offset the decline in food trade (-0.6%) and clothing stores (-1.9%).
UK retail sales growth year-on-year: UK retail sales rose 3.3% year-on-year, following a 3.8% increase in July and easily exceeded market expectations of 2.3%.
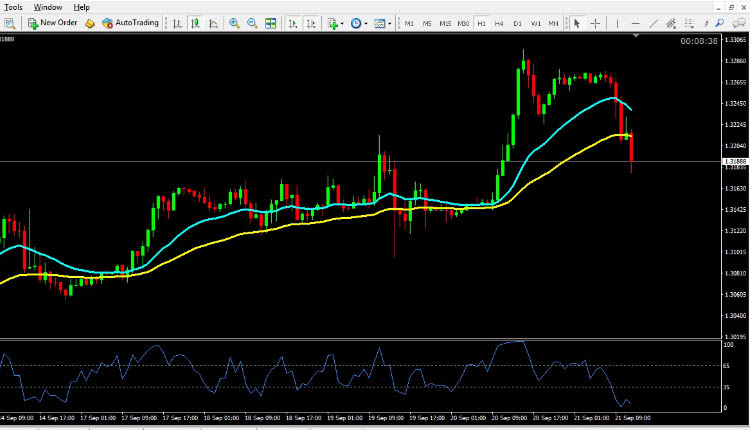
GBP USD technical analysis September 21, 2018
The pair is expected to find support at 1.3163, and a fall through could take it to the next support level of 1.3330 The pair is expected to find its first resistance at 1.3397, and a rise through could take it to the next resistance level of 1.3268. For today the expected trading range is between 1.3095, Support and 1.3225 Resistance.
The expected trend for today is Bearish
Supports Levels: Support 1: 1.3163 Support 2: 1.3064 Support 3: 1.3000
Resistance Levels: Resistance 1: 1.3330 Resistance 2: 1.3397 Resistance 3: 1.3497
Previous day`s high: 1.3297
Previous day`s low: 1.3130
GBP/USD Buying Opportunity for Intraday Trading September 21, 2018
Buy near the support area 1.3163 and 1.3064 as soon as you get reversal candlesticks patterns like Hammer, Bullish Englufing, Long Leged Doji or Dragonfly Doji, using stop loss 2 pips below the reversal candlestick & keep target equal to stop loss.
EUR/USD Selling Opportunity for Intraday Trading September 21, 2018
Sell near the resistance area 1.3330 and 1.3397 as soon as you get reversal candlesticks patterns like Shooting Star, Bearish Englufing, Long Leged Doji or Gravestone Doji, using stop loss 2 pips above the reversal candlestick & keep target equal to stop loss.
EUR/USD Technical Analysis September 21, 2018
USD/JPY Technical Analysis September 21, 2018
USD/CAD Technical Analysis September 21, 2018