GBP USD Technical Analysis October 01, 2018
The GBP declined 0.35% against the USD on Friday and closed at 1.3027. Today in the Europen session while preparing GBP USD technical analysis October 1, 2018 at 10:15 GMT, the GBP/USD is trading at 1.3040, which is 0.09% higher against the USD from yesterday’s close.
In European session, data showed that the in the three months to June 2018, the UK economy grew by 0.4% quarter-on-quarter, from the first estimate without correction, up from 0.1% in the previous period. Business investment contracted unexpectedly, and household consumption grew faster than initially expected.
UK GDP annual growth rate: The UK’s GDP grew by 1.2% year-on-year in the second quarter of 2018, revised from a preliminary estimate of 1.3%, and did not change much from the previous six-year low of 1.1%. Household consumption and net external demand have contributed positively to GDP growth while business investment has decreased.
When the European market opens, the economic data will release such as Manufacturing PMI, Net Lending to Individuals m/m, M4 Money Supply m/m, Mortgage Approvals
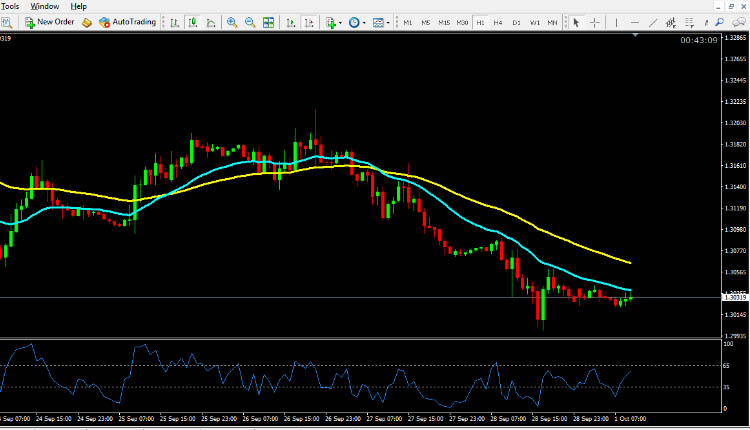
GBP USD Technical Analysis October 1, 2018
The pair is expected to find support at 1.2988, and a fall through could take it to the next support level of 1.2950 The pair is expected to find its first resistance at 1.3078, and a rise through could take it to the next resistance level of 1.3128. For today the expected trading range is between 1.2950, Support and 1.3128 Resistance.
The expected trend for today is Bullish
Supports Levels: Support 1: 1.2988 Support 2: 1.2950 Support 3: 1.2900
Resistance Levels: Resistance 1: 1.3078 Resistance 2: 1.3128 Resistance 3: 1.3168
Previous day`s high: 1.3177
Previous day`s low: 1.3073
GBP/USD Buying Opportunity for Intraday Trading October 1, 2018
Buy near the support area 1.2088 and 1.2950 as soon as you get reversal candlesticks patterns like Hammer, Bullish Englufing, Long Leged Doji or Dragonfly Doji, using stop loss 2 pips below the reversal candlestick & keep target equal to stop loss.
EUR/USD Selling Opportunity for Intraday Trading October 1, 2018
Sell near the resistance area 1.3078 and 1.3128 as soon as you get reversal candlesticks patterns like Shooting Star, Bearish Englufing, Long Leged Doji or Gravestone Doji, using stop loss 2 pips above the reversal candlestick & keep target equal to stop loss.
EUR/USD Technical Analysis October 1, 2018
USD/JPY Technical Analysis October 1, 2018
USD/CAD Technical Analysis October 1, 2018