
GBP USD Technical Analysis August 20 2018
The GBP declined 0.32% against the USD on Friday and closed at 1.2750. Today in the European session while preparing GBP USD technical analysis august 20, 2018 at 9:45 GMT, the is trading at 1.2730, which is 0.15% lower against the USD from yesterday’s close.
In Europe, UK will not release any Economic Data, but the US will release Members of the Federal Reserve FOM have voted to determine the country’s major interest rates and their public activities are often used to release subtle signs in relation to future monetary policy. In line with market expectations in August 2018. The Fed placed its target range at 1.75% to 2% for the federal fund rate. Policymakers said that abor market continued to strengthen and that economic activity was increasing at a strong rate, suggesting a possible rate hike at its next meeting in September 2018.
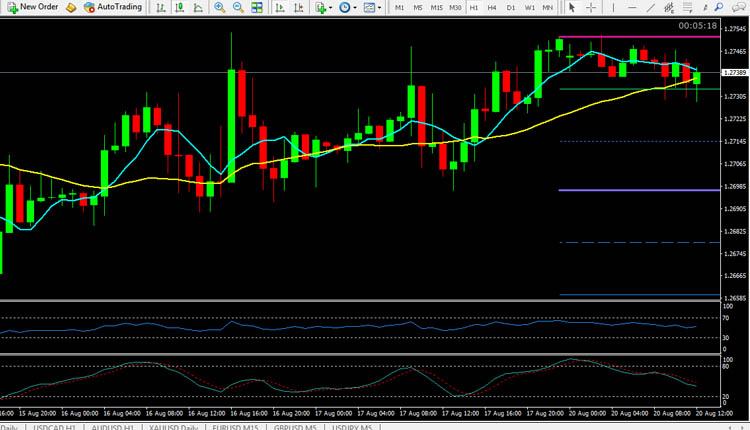
GBP USD technical analysis august 20 2018.
The pair is expected to find support at 1.2715. And a fall through could take it to the next support level of 1.2680. The pair is expected to find its first resistance at 1.2770. And a rise through could take it to the next resistance level of 1.2788. For today the expected trading range is between 1.2680, Support and 1.2788 Resistance.
The expected trend for today is Bullish
Supports Levels: Support 1: 1.2715 Support 2: 1.2680 Support 3: 1.2659
Resistance Levels: Resistance 1: 1.2770 Resistance 2: 1.2788 Resistance 3: 1.2824
Previous day`s high: 1.2751
Previous day`s low: 1.2697
GBP/USD Buying Opportunity for Intraday Trading August 20, 2018
Buy near the support area 1.2715 and 1.2680 as soon as you get reversal candlesticks patterns like Hammer, Bullish Englufing, Long Leged Doji or Dragonfly Doji
EUR/USD Selling Opportunity for Intraday Trading August 20, 2018
Sell near the resistance area 1.2770 and 1.2788 as soon as you get reversal candlesticks patterns like Shooting Star, Bearish Englufing, Long Leged Doji or Gravestone Doji
EUR/USD Technical Analysis August 20, 2018