
Crude Oil Technical Analysis September 26, 2018
The Crude Oil declined 0.20% against the USD on Tuesday and closed at 71.95. Today in the European session while Crude Oil technical analysis September 26, 2018 is preparing at 10:45 GMT, the Crude Oil trading at 71.90, which is 0.6% lower from Yesterday’s close.
Oil prices eased on Wednesday, but Iran’s exports are about to fall in the last three months of this year as global demand heats up, and oil prices continue to rise for the fifth consecutive month. Several big buyers of Iranian crude oil, such as some Indian refiners, have said they will reduce their purchases, but the exact impact of Iranian barrel losses on the global market balance is unclear.
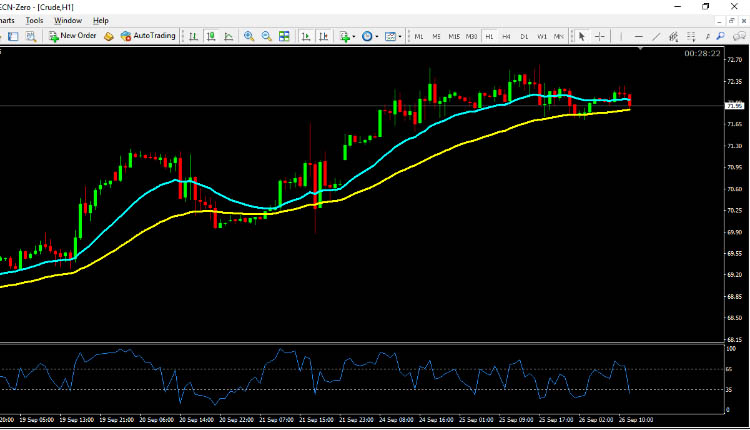
Crude Oil technical analysis September 26 2018
The pair is expected to find support at 71.28 and a fall through could take it to the next support level of 70.80. The pair is expected to find its first resistance at 72.45, and a rise through could take it to the next resistance level of 72.95. For today the expected trading range is between 71.28, Support and 72.95 Resistance.
The expected trend for today is Bearish
Supports Levels: Support 1: 71.62 Support 2: 71.28 Support 3: 70.80
Resistance Levels: Resistance 1: 72.45 Resistance 2: 72.95 Resistance 3: 73.27
Previous day`s high: 72.57
Previous day`s low: 71.06
Crude Oil Buying Opportunity for Intraday Trading September 26, 2018
Buy near the support area 71.28 and 70.80 as soon as you get reversal candlesticks patterns like Hammer, Bullish Englufing, Long Leged Doji or Dragonfly Doji, using stop loss 2 pips below the reversal candlestick & keep target equal to stop loss.
Crude Oil Selling Opportunity for Intraday Trading September 26, 2018
Sell near the resistance area 72.45 and 72.95 as soon as you get reversal candlesticks patterns like Shooting Star, Bearish Englufing, Long Leged Doji or Gravestone Doji, using stop loss 2 pips above the reversal candlestick & keep target equal to stop loss.