
USD JPY Technical Analysis August 16 2018
The USD declined 0.36% against the JPY on Tuesday and closed at 110.72. Today in the European session while this usd jpy technical analysis august 16, 2018 is preparind at 9:45 GMT, the USD/JPY trading at 110.75, which is 0.02% higher against the JPY from yesterday’s close.
In Japan, data showed that Japan recorded a trade deficit of 231 billion yen in July of 2018, compared with a surplus of 407 billion yen a year ago and a consensus gap of 50 billion yen. Exports rose 3.9 percent year-on-year to 6747 billion yen, up 6.7 percent in June and below expectations of a 6.3 percent increase. Meanwhile, imports grew 14.6 percent year-on-year to 6,979 billion yen, up from 2.5 percent in June and slightly above market expectations of 14.4 percent. Japan’s trade balance averaged 364.27 billion yen from 1963 to 2018, reaching an all-time high of 1608.67 billion yen in September 2007 and hitting a record low of -2795.12 billion yen in January 2014.
Today’s Economic Data from US
When the US market opens, some Economic Data will be released such as Building Permits are expected to increase to 1.31M, Housing Starts are expected to increase to 1.27M, Philly Fed Manufacturing Index is expected to decrease 21.9 and Unemployment Claims is expected to increase to 230k
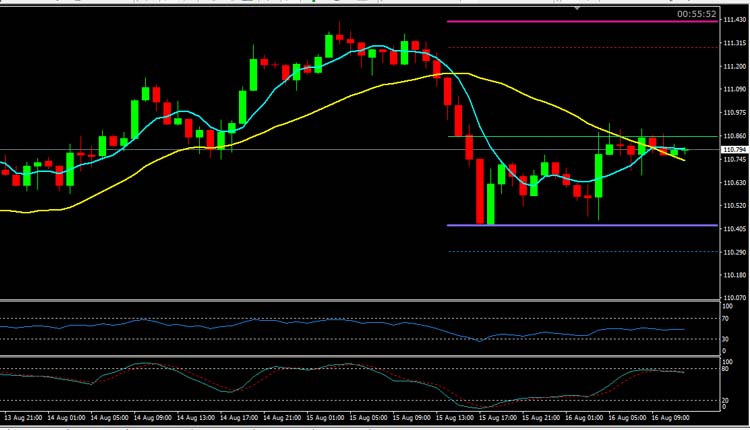
The pair is expected to find support at 110.30, and a fall through could take it to the next support level of 109.85. The pair is expected to find its first resistance at 111.30, and a rise through could take it to the next resistance level of 111.85. For today the expected trading range is between 109.85, Support and 111.30 Resistance.
The expected trend for today is Bullish
Supports Levels: Support 1: 110.30 Support 2: 109.85 Support 3: 109.30
Resistance Levels: Resistance 1: 111.30 Resistance 2: 111,85 Resistance 3: 112.30
Previous day`s high: 111.30
Previous day`s low: 11042