
USD JPY Technical Analysis September 20, 2018
The USD declined 0.07% against the JPY on Wednesday and closed at 112.26. Today in the European session while USD JPY technical analysis September 20, 2018 is preparing at 10:45 GMT, the USD/JPY trading at 112.22, which is 0.03% lower against JPY from yesterday’s close.
Yesterday in Asian session, data showed that the The Bank of Japan reiterated on Wednesday that it will “Interest rates have kept very low for a long time” and holds forward-looking guidance for the first time in July. After a series of adjustments in July, the Bank of Japan decided to stick to its policy to cope with the long-standing struggle to boost inflation. The board of directors maintained a short-term interest rate of minus 0.1% with a 7-2 vote and maintained the 10-year Japanese government bond yield target near zero. It reaffirmed the commitments made in July to allow bond yields to develop in a more flexible manner with the goal of restoring the dying government bond market.
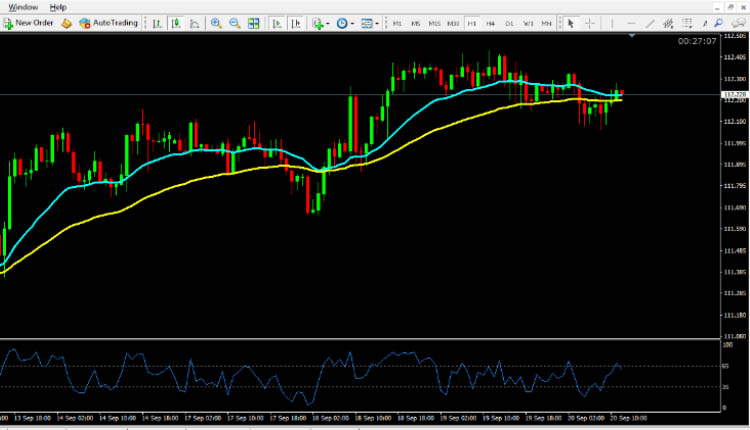
USD JPY technical analysis September 20, 2018
The pair is expected to find support at 112.10. And a fall through could take it to the next support level of 112.00. The pair is expected to find its first resistance at 112.42, and a rise through could take it to the next resistance level of 112.57. For today the expected trading range is between 111.00, Support and 112.26 Resistance.
The expected trend for today is Bullish
Supports Levels: Support 1: 112.10 Support 2: 112.00 Support 3: 111.85
Resistance Levels: Resistance 1: 112.42 Resistance 2: 112.57 Resistance 3: 112.70
Previous day`s high: 112.43
Previous day`s low: 112.15
USD/JPY Buying Opportunity for Intraday Trading September 20, 2018
Buy near the support area 111.10 and 111.00 as soon as you get reversal candlesticks patterns like Hammer, Bullish Englufing, Long Leged Doji or Dragonfly Doji
USD/JPY Selling Opportunity for Intraday Trading September 20, 2018
Sell near the resistance area 112.42 and 112.57 as soon as you get reversal candlesticks patterns like Shooting Star, Bearish Englufing, Long Leged Doji or Gravestone Doji
EUR/USD Technical Analysis September 20, 2018
GBP/USD Technical Analysis September 20, 2018
USD/CAD Technical Analysis September 20, 2018