Technical Indicators
Technical indicators are used to predict the future price level of securities or simply the overall price direction by looking at past patterns. There are many technical indicators, and some common technical indicators include moving averages, Bollinger Bands, Relative Strength Index, Stochastic Oscillator, MACD, etc.
For long-term investors, the most effective technique to use is to analyze long-term trends to help determine the stock’s good entry and exit points. Technical analysis is a trading tool used to evaluate securities and try to predict future changes by analyzing statistical data collected from trading activities (such as price changes and trading volumes).
Technical indicators represent a statistical method of technical analysis, not a subjective method. It is a series of data points obtained by applying formulas to the price data of securities. Price data includes any combination of opening price, highest price, lowest price or closing price over a period of time. Some indicators may use only the closing price, while other indicators include volume and open positions in their formulas. The indicator generates buy and sell signals by calculating the market’s past prices.
For example, the average of 14 days closing prices of EUR/USD is one data point [(1.1607+1.1607+1.1584+1.1592+1.1640+1.1663+1.1665+1.1796+1.1789+1.1769
+1.1788+1.1731+1.1737+1.1740)/ 14 = 1.0850].
Here are some of the most powerful indicators.
Moving Average
The moving average (MA) indicator is a price calculation indicator that analyzes data points by creating a series of averages of different subsets of the complete data set. It can smooth price data to form a trend that follows the indicator. Moving averages help smooth price movements and filter out noise.
Moving averages are often used with time series data to eliminate short-term fluctuations and highlight long-term trends or periods. The most common application of moving averages is to determine the trend direction and determine support and resistance levels.
When the market trend is up, you can use the moving average to determine the trend and the right time to buy; when the market trend is down, you can use the moving average to determine the trend and the correct selling time.
A moving average is a drawn line that only measures the average price of a currency pair, commodities or stocks during a specific time period, such as the price movements of the last 14 days, 20 days, 50 days, 100 days, 200 days, or one year to understand the overall direction.
The two most popular types of moving averages are simple moving average (SMA) and exponential moving average (EMA). These two popular moving averages can be used to determine the direction of any financial market trend.
Simple Moving Average
The simple moving average (SMA) is mostly used indicator it is the simplest type of moving average. It it calculated by adding the closing price of any security for a number of time periods, and then divide the total number by the number of time periods.
Simple Moving Average Calculation
The simple moving average (SMA) is an average of the last n prices, where n is the number of periods
(Price1 + Price2 + ………….……… + Pn) / n
A14-period SMA with prices of 1.1225,1.1215,1.1230,1.1245,1.1260,1.1275,1.1255,1.1269,1.1277,1.1240,1.1257,
1.1231,1.1237& 1.1250 gives a moving average of 1.0850 using the calculation [(1.1225+1.1215+1.1230+1.1245+1.1260+1.1275+1.1255+1.1269+1.1277+1.1240
+1.1257+1.1231+1.1237+1.1250)/ 14 = 1.1247].
Exponential Moving Average
The exponential moving average is a similar to simple moving average, except that more weight is given to the latest data.
Calculation of Exponential Moving average
To calculate exponential moving average (EMA), take current price & multiply it by constant (C). Take previous period`s EMA & multiply it by 1 minus that constant (C). Add the two values together.
EMA(Current)=C*Price(Current)+(1-C)*EMA (Previous Period)
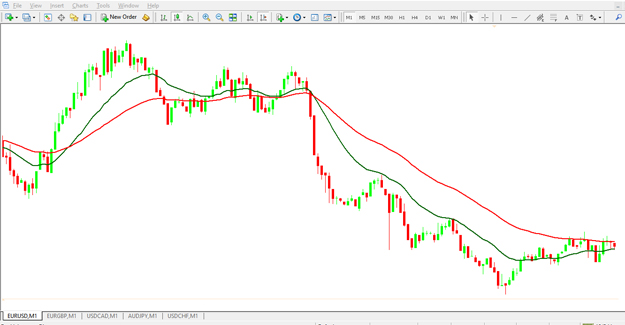
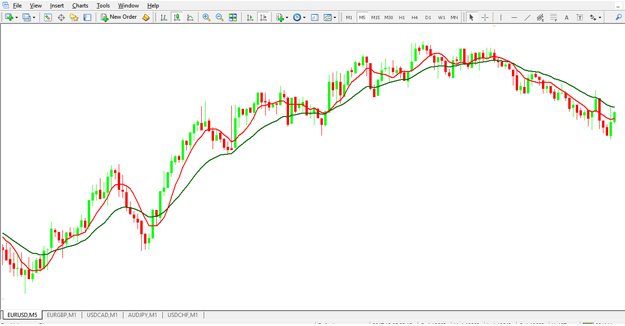
How to Use Moving Averages
A rising moving average indicates that the current market is in an upward trend, while a falling moving average indicates that the market is in a downward trend. When the moving average rise, we should find support areas to buy securities; similarly, when the moving average falls, we should look for resistance areas to sell securities.
Bollinger Band
The Bollinger Band is a technical tool developed by John Bollinger in the 1980s. Bollinger Band is a volatility indicator, located above and below the moving average. The volatility is based on the standard deviation, and the volatility changes with the increase and decrease of the volatility; when the volatility increases, the band automatically widens; when the volatility decreases, the band automatically narrows; the outer band is set to be above and below the mid-band.
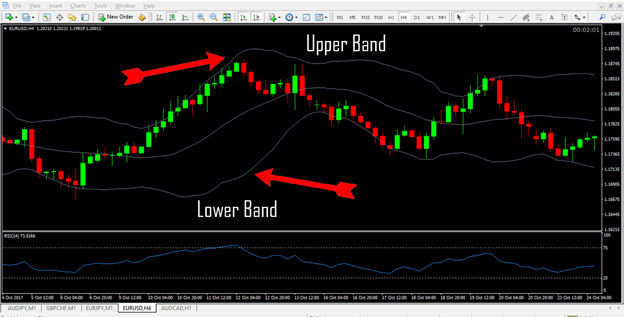
Trading Uptrends with Bollinger Bands
Bollinger bands tell us how strongly an asset is rising upward. When the price is in a strong upward trend, it usually touches or runs along an upper band. When prices are in a strong upward trend, it should not touch the lower band. If it does, it is a warning signal indicating a reversal.
Trading Downtrends with Bollinger Bands
Bollinger bands help assess how strongly an asset is falling downward. When the price is in a strong downward trend, it usually touches or runs along the lower band. When prices are in a strong downward trend, the upper band should not be touched. If it is, it is a warning signal indicating a reversal.
Best mt4 Indicators:
Download Candle Closing Time Indicator:
Easy Trading Candle Closing Time provides accurate remaining time to close the current candle for those who want to know how much time is left before the candle closes. The indicator shows the time in the upper right corner of the chart. This indicator basically calculates the difference between the opening time of the next candle and the current candle time. Then display it as the remaining time.

Download Pivot Points Indicator:
The pivot point indicator is based on a special mathematical algorithm that can predict the future reversal of any market with a high probability. Our pivot point indicator is very easy to use. The all-in-one indicator automatically draws pivot points and all support and resistance on any mt4 chart.
Download MACD Indicator:
The MACD Indicator is a price momentum oscillator that traders typically use as a signal for entry or exit positions. In a range, bearish, or bullish market, MACD (moving averages convergence divergence) can be employed. You can download the MACD indicator from the link provided below.
Download Supertrend Indicator:
Supertrend It is a trend-following indicator, just like moving averages, that helps traders identify buy and sell signals based on the overall trend. Super-trend is one of the easiest ways to scan the markets for buy and sell opportunities.