GBP USD Technical Analysis August 16 2018
The GBP declined 0.20% against the USD on Wednesday and closed at 1.1343. Today August 16, 2018 in the Asian session at 8:15 GMT, the GBP/USD is trading at 1.2715, which is 0.16% higher against the USD from yesterday’s close.
In the UK, the data showed that the annual inflation rate in the UK rose to 2.5% in July from a one-year low of 2.4% in June and in line with market expectations. The cost has risen more rapidly in the areas of transportation, entertainment, culture, housing, facilities, and food and non-alcoholic beverages. The average inflation rate in the United Kingdom was 2.58 per cent between 1989 and 2018, reaching an all-time high of 8.50 per cent in April 1991 and a record low of -0.10 per cent in April 2015.
When the European market opens, retail sales data will be released. Retail sales in the UK are expected to rise by 0.2% in July, while rising by 3.0% during the year. Core sales excluding heating oil sales were up 0.1% month-on-month in July, while rising 2.8% y/y. Hot weather keeps shoppers hiding from the sun instead of shopping on the main street. UK retail sales are expected to rise by 0.2% in July after unexpectedly dropping by -0.5% month-on-month in June. The National Statistics Office is due to release on Thursday, August 15 at 8:30 GMT. Total retail sales rose by 3.0% year-on-year, up from 2.9% in June.
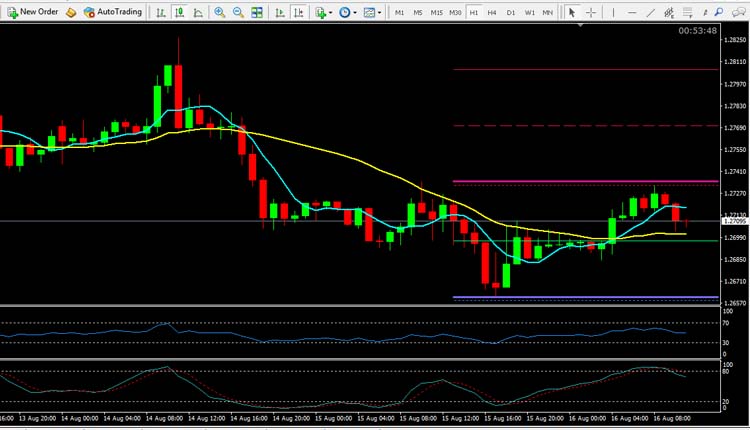
The pair is expected to find support at 1.2660, and a fall through could take it to the next support level of 1.2723. The pair is expected to find its first resistance at 1.2732, and a rise through could take it to the next resistance level of 1.2770. For today the expected trading range is between 1.2660, Support and 1.2770 Resistance.
The expected trend for today is Bearish
Supports Levels: Support 1: 1.2660 Support 2: 1.2623 Support 3: 1.2558
Resistance Levels: Resistance 1: 1.2723 Resistance 2: 1.2770 Resistance 3: 1.2805
Previous day`s high: 1.2734
Previous day`s low: 1.2661