
EUR USD Technical Analysis September 26, 2018
The EUR rose 0.16% against the USD on Tuesday and closed at 1.1765. Today in the European session while EUR USD technical analysis September 26, 2018 is preparing at 10:15 GMT, the pair is trading at 1.1755, which is 0.08% lower from yesterday’s closed.
In European session, data showed that according to the Federal Statistical Office (Destatis), the sales price of wholesale trade in August 2018 increased by 3.8% compared with the same period of last year. The annual rate of change in July 2018 and June 2018 was + 3.6% and + 3.4%, respectively. From July 2018 to August 2018, the index rose 0.3%.
In US session, data showed that after the upward revision of the 6.4% increase in June and the market’s expected 6.2% increase, the US Standard & Poor’s CoreLogic Case – Schiller 20 City Comprehensive Housing Price Index rose 5.9% compared with the same period last year.
HPI m / m:.S. According to the seasonally adjusted monthly house price index (HPI) of the Federal Housing Finance Agency (FHFA), house prices rose by 0.2 percentage points in July. The previously reported June growth was 0.2%, up to 0.3%.
Richmond Manufacturing Index: According to a recent survey by the Federal Reserve Bank of Richmond, manufacturing activity in the Fifth District was strong in September. Due to the increase in shipments and new orders, the composite index rose from 24 in August to 29 in September, while the third portion of the employment index declined.
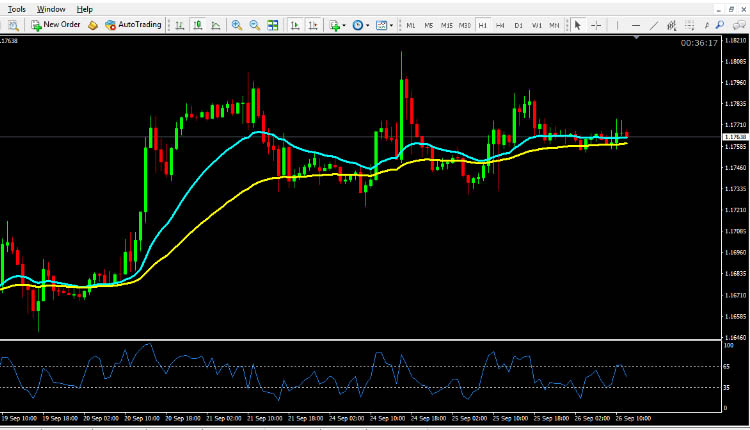
EUR USD technical analysis September 26, 2018
The pair is expected to find support at 1.1733 and a fall through could take it to the next support level of 1.1700. The pair is expected to find its first resistance at 1.1795, and a rise through could take it to the next resistance level of 1.1824. For today the expected trading range is between 1.1733, Support and 1.1795 Resistance.
The expected trend for today is Bullish
Supports Levels: Support 1: 1.1733, Support 2: 1.1700, Support3: 1.1672
Resistance Levels: Resistance 1: 1.1795, Resistance 2: 1.1824, Resistance 3: 1.1856
Previous day`s high: 1.1791
Previous day`s low: 1.1730
EUR/USD Buying Opportunity for Intraday Trading September 26, 2018
Buy near the support area 1.1733 and 1.1700 as soon as you get reversal candlesticks patterns like Hammer, Bullish Englufing, Long Leged Doji or Dragonfly Doji, using stop loss 2 pips below the reversal candlestick & keep target equal to stop loss.
EUR/USD Selling Opportunity for Intraday Trading September 26, 2018
Sell near the resistance area 1.1795 and 1.1824 as soon as you get reversal candlesticks patterns like Shooting Star, Bearish Englufing, Long Leged Doji or Gravestone Doji, using stop loss 2 pips above the reversal candlestick & keep target equal to stop loss.
GBP/USD Technical Analysis September 26, 2018
USD/JPY Technical Analysis September 26, 2018
USD/CAD Technical Analysis September 26, 2018