Top 10 Candlestick Patterns
In this article, we will discuss the top 10 candlestick patterns of the world. There are many candlestick patterns, but some are very important in online trading. Candlesticks can indicate the price movement and market sentiment of a certain currency pair, commodity, or stock.
Candlestick patterns show price changes. Each candle shows current and historical prices, according to the high, low, opening, and closing prices of a specific period. The widest part of the candle from the opening price to closing price is called the real body of the candle. The shadow of the candlestick shows the high and low prices during the period.
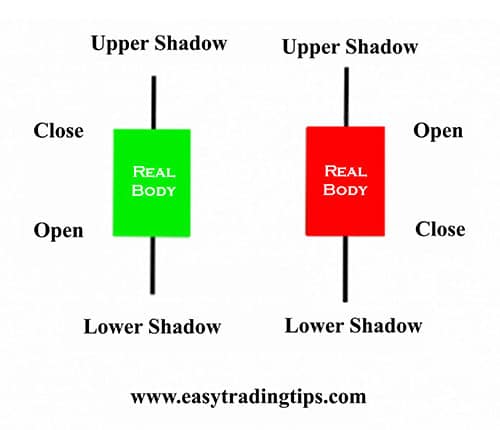

A white or green candlestick indicates a price increase. Black or red candlesticks indicate that prices are falling. There may be more than 100 individual candlesticks and candlestick patterns. Each of them has a specific meaning and trading ability. Some candle patterns are more useful than others. The following are the “top 10 candlestick patterns”.
Top 10 candlestick patterns of the world
First, we will discuss the top 5 bullish candlestick patterns and then we will discuss the top 5 bearish candlestick patterns.
Top 5 most powerful bearish candlestick patterns
1. Hammer
Among the top 10 candlestick patterns, the Hammer candle is the most powerful bullish candlestick pattern. Because the hammer candlestick gives excellent results in forex trading. Traders use this candlestick to find the reversal trading single. This is a strong bullish candlestick pattern with a long shadow, which appears when the market price is much lower than its opening price. However, the closing price at the end of the day is higher than its opening price.
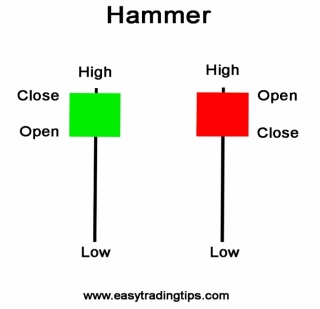
The candle looks like an exact hammer. To form a perfect hammer, the lower shadow should be at least twice that of its main body. Then it will indicate a very strong bullish signal.
When you see the perfect hammer after a downtrend, this is a potential sign of market reversal. But before placing an order, you should wait for the next candle to open higher than the previously closed candle to confirm the bullish signal.
Criteria for a perfect buy signal
- The lower shadow of the hammer candle should be at least twice its real body.
- The hammer candlestick should be formed at the end of a downtrend.
- The color of the body is not important. Although a white or green body should play a more important role in bullish signals.
- The longer the lower shadow of the Hammer candlestick, the higher the possibility of reversal.
- There should not be an upper shadow or a very small upper shadow.
- Candles should be formed in the support area or oversold area
2. Inverted Hammer
The Inverted hammer is another important bullish reversal candlestick pattern. This is a powerful candle with a long shadow that occurs upside when the market price is much higher than its opening price. But it rallies later in the day to close above or near its opening price. The inverted hammer looks like an inverted version of the hammer candlestick pattern. The shadow of the inverted hammer should be at least twice its real body.
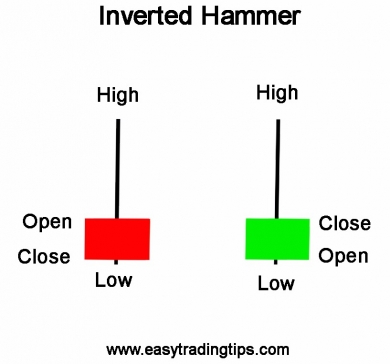
When you see an inverted hammer after a downward trend, this is an important sign of a potential market reversal. But before taking any position, you should wait for the opening price of the next candle to be higher than the closing price of the previous candle.
Criteria for a perfect buy signal
- The upper shadow should be at least twice its actual length.
- The color of the body is not important. Although a white or green body should play a more important role in a bullish signal.
- The longer the upper shadow of the inverted hammer candlestick pattern, the higher the possibility of reversal.
- There should not be a lower shadow or a very small lower shadow.
- Candles should be formed in support or oversold zone.
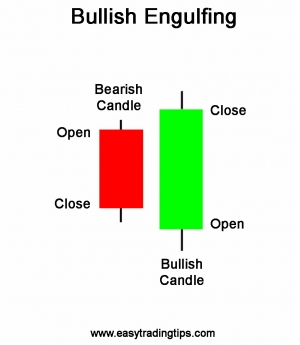
3. Bullish Engulfing
In the list of top 10 candlestick patterns, the bullish engulfing pattern is the most powerful reversal candlestick pattern. The bullish engulfing candlestick is bullish in nature and appears at the end of the downtrend. When small bearish candles are engulfed by large bullish candles, a bullish engulfing pattern appears. The first candle should be a falling black candle, and the second candle should be a reverse green candle.
 Before taking any positions, you must check strong support using horizontal, trend lines, etc. And use RSI, stochastic indicators, and other indicators to get confirmation of oversold. When you get any confirmation of the support level or oversold area, you can buy the currency pair.
Criteria for a buy signal
- The body of the second-day candle of bullish engulfing should be completely engulfed by the real body of the first-day candle.
- The prices should be at the bottom of the downtrend.
- The body of the second candle should be the opposite in color (white or red) of the first-day candle.
- The higher the open gap than the previously closed, the higher the probability of a strong bullish signal.
- The bullish engulfing candlestick pattern should be formed in the support zone or an oversold zone.
4. Piercing Pattern
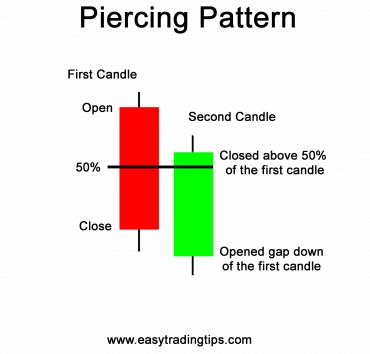
The piercing pattern is a powerful reversal candlestick pattern that appears at the end of a downtrend. The Piercing pattern is a combination of two candlesticks. The first candle is bearish (red or black) and the second candle is bullish (green or white). The price of the second candle should open below the first day’s low and must close above the middle of the previous candle.
Criteria for a perfect buy signal
- The first-day candle should be black or red in nature and appear at the end of the downtrend.
- The second-day green candle should be closed for more than half of the black or red candle.
- The greater the gap down from the previous day’s close, the more powerful the reversal.
- The big volume during these two trading days is a strong confirmation of a bullish signal.
- Piercing Patterns should be formed on the support level or overbought zone.
5. Doji
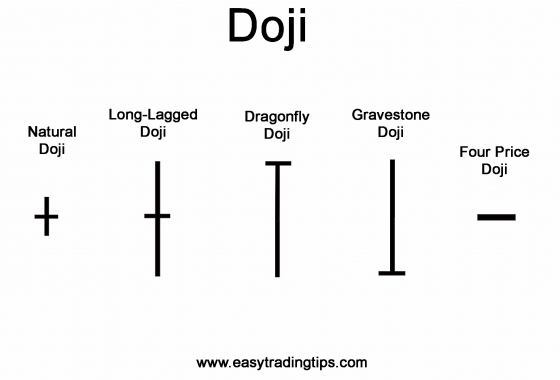
A Doji appears when the opening price and closing price are equal. Many traders believe that Doji candles are the best way to trade. A Doji candlestick pattern is formed on the support and resistance areas. The Doji candlestick pattern provides reversal information about itself. The length of the upper and lower shadows can vary, so the candlestick will be crossed or plus sign. The Doji candlestick pattern is a neutral pattern. It expresses a sense of uncertainty. There are five main patterns of Doji candlesticks.
Neutral Doji
Long Lagged Doji
Gravestone Doji
Dragonfly Doji
The 4 Price Doji
Neutral Doji
A Neutral Doji is a small candle and looks like a cross or plus sign. This pattern occurs when the stock opens and closes in the middle of the day.
Long-Legged Doji
In a Long-legged Doji, the upper and lower shadows are quite long compared to natural Doji. During any time frame, the price moves dramatically up and down but closes at the same level as it opened. This pattern occurs when supply and demand forces are at equilibrium and it shows uncertainty between buyers and sellers.
Gravestone Doji
A Gravestone Doji occurs when the opening and closing prices are equal and occur at the low of the day. This pattern forms when the supply and demand forces are in balance.
Dragonfly Doji
Dragonfly Doji appears when the opening and closing prices are equal. The Dragonfly Doji forms when the supply and demand forces are at equilibrium.
The 4 Price Doji
The 4 Price Doji is a horizontal line without any upper and lower shadow. It looks like a minus sign the candle’s high, low, open, and close prices are exactly the same.
Criteria for a perfect buy signal
The first thing you need to know is that the Doji candlestick is only significant after an extended move to the upside or downside. To buy any stock the Doji candle must be in the support area or oversold zone. These patterns are used as entry and exit points. When the Doji is at the support level, it can be used as an entry point. Similarly, when Doji forms, in the resistance level, it can be used as an exit point.
Top 5 most Powerful Bearish Candlestick Patterns
1. Shooting Star
Among the top 10 candlestick patterns, Shooting Star is one of the most powerful bearish candlestick patterns. Because it provides excellent results in forex trading. It has a very small real body, and large shadows. Shooting Star looks like an inverted hammer, but it is formed on the top of an uptrend. The upper shadow of a Shooting Star should be at least twice its real body. Then it shows a very strong bearish signal.
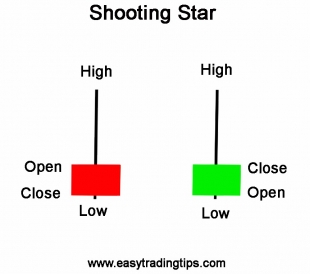
When you see the Shooting Star after an upward trend, this is a good sign that the market may reverse. But before taking any position, you should wait for the opening price of the next candle to be lower than the closing price of the previous candle.
Criteria for a perfect buy signal
- The upper shadow of the Shooting Star should be at least twice its real body.
- The color of the body is not important. Although a black or red body should play a more important role in bearish signals.
- There should be no upper shadow or a very small upper shadow.
- The next day’s candle needs to be confirmed with a red candle, and the red candle has a higher closing price.
- The longer the upper shadow of the Shooting Star, the higher the possibility of reversal.
2. Hanging Man
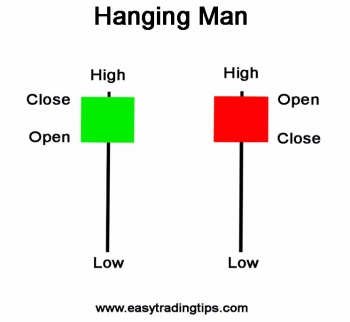
The Hanging Man is the top reversal candlestick pattern that forms on the top of an uptrend. The candle is made of only one candle with a long shadow, and there is a small red body on the upper edge of the candle. A small upper shadow may appear on the top of the body. The hanging man candlestick pattern is like a hammer but appears at the end of an upward trend.
Criteria for a perfect sell signal
- The lower shadow should be at least twice its actual body.
- The real body should be at the upper end of the trading range.
- The color of the body is not important, although a black or red body should be slightly more important.
- There should be no upper shadow or a very small shadow.
- The longer the lower shadow of the hanging man, the greater the possibility of reversal.
- Candles should be formed in the resistance zone or overbought zone.
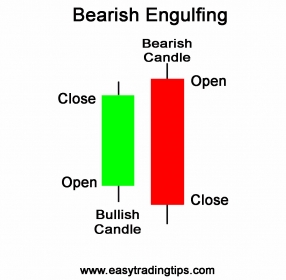
3. Bearish Engulfing Pattern
The Bearish Engulfing pattern is the most powerful bearish candlestick pattern. The bearish Engulfing candlestick pattern is bearish in nature and appears at the end of an upward trend. Comparing with bullish Engulfing, the bearish Engulfing pattern has exactly the opposite functions.
This happens when a small bullish candle is engulfed by a large bearish candle. The first candle is white or green, and the second candle is black or red. When a bearish engulfing pattern is formed at the end of the upward trend, the reversal is more effective.
Before placing an order, you need to use the indicator RSI, stochastic, etc. to check the resistance or overbought areas. After you get any confirmation, you can buy the stock using proper stop-loss.
Criteria for a perfect sell signal
- The body of the first-day candle must be completely engulfed by the body of the second-day candle.
- The price should be in an upward trend.
- The body of the second-day candle should be opposite in color.
- The Bearish engulfing candlestick pattern should be formed in resistance area or oversold area
4. Dark Cloud Cover
The Dark Cloud Cover is a reversed bearish candlestick pattern. Dark cloud cover appears at the end of the upward trend. The dark cloud cover pattern is formed by combining two candlesticks. The first-day candle is bullish (green or white), and the second candle is bearish (red or black). The price opens at almost low of the day and it closes almost at the top for that day. This leads to the formation of a bullish candle, which is the first candle. The price of the second candle opens above the high of the previous candle and must close below the middle of the first day.
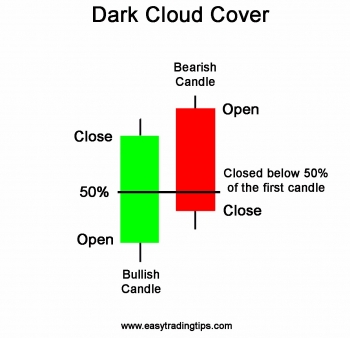
Criteria for a perfect sell signal
- The first-day candle should be bullish (white or green) and appear at the end of the upward trend.
- The next day (black or red) candles should be closed for more than half of the previous candle.
- The longer the white candle and the black candle, the more powerful the reversal.
- The greater the gap from the closing price of the previous days, the stronger the reversal.
- The large volume in these two trading days confirms the strong bullish signal.
5. Doji
When the opening price and closing price are equal, a cross sign will appear. Many traders believe that this candlestick pattern is one of the best trading patterns. There are five main patterns of Doji candlesticks.

Neutral Doji
The neutral Doji is a small candlestick pattern that looks like a cross or plus sign. This pattern occurs when the stock opens and closes between the highs and lows of the day.
Long-Legged Doji
The long-legged Doji has long upper and lower shadows than natural Doji. In any time frame of the candle, the price will fluctuate sharply up and down, but the closing price is the same as the opening price. This pattern is formed when supply and demand are in equilibrium, which indicates hesitation between buyers and sellers.
Gravestone Doji
Gravestone Doji occurs when the opening price and closing price are equal, which occurs at the low of the day. This pattern will be formed when supply and demand are in equilibrium.
Dragonfly Doji
Dragonfly Doji occurs when the opening and closing prices are equal and occurs at the high point of the day. When the supply and demand are in equilibrium, the dragonfly Doji is formed.
The 4 Price Doji
4 Price Doji is just a horizontal line without any shadows. It looks like a minus sign. The candle’s high and low, the opening and closing prices are exactly the same.
Criteria for a Sell signal
The first thing you need to know is that the Doji candlestick only makes sense after moving up or down. These patterns are used as entry and exit points. When the Doji is formed at the resistance level, it can be used as an entry point. Similarly, when the Doji is formed at the support level, it can be used as an exit point.