
EUR USD Technical Analysis September 18, 2018
The EUR rose 0.51% against the USD on Monday and closed at 1.1682. Today in the Asian session while EUR USD technical analysis September 18, 2018 is preparing at 8:15 GMT, the pair is trading at 1.1680, which is 0.01% lower from yesterday’s closed.
In Europe, data showed that the annual inflation rate in the Eurozone in August 2018 was 2.0%, down from 2.1% in July 2018. In the same period last year, the ratio was 1.5%. In August 2018, the EU’s annual inflation rate was 2.1%, down from 2.2% in July. A year ago, the ratio was 1.7%.
When the US market opens, the economic data will release NAHB Housing Market Index: In August 2018, the NAHB housing market index fell to 67 from 68 in the previous month, as the market generally expected. This is the lowest since September last year, as all components are down: current single-family home sales (73 vs. 74 in July); prospective buyers (49 vs. 51); and home sales for the next six months (72 to 73). The US Nahb housing market index averaged 50.06 from 1985 to 2018, hit a record high of 78 in December 1998, and hit a record low of 8 in January 2009.
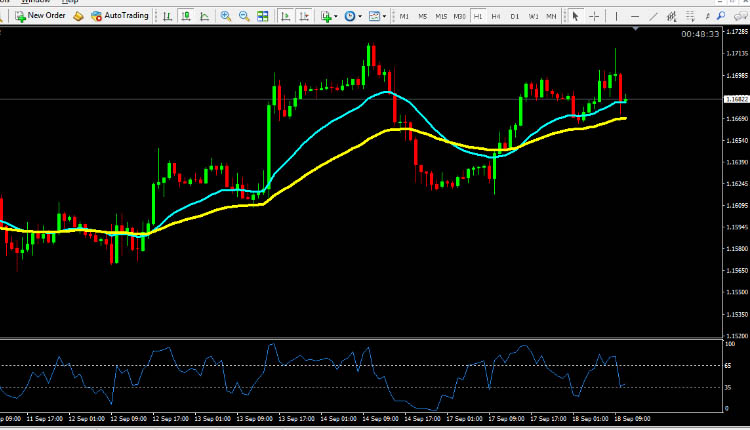
EUR USD technical analysis September 18, 2018
The pair is expected to find support at 1.1633 and a fall through could take it to the next support level of 1.1585. The pair is expected to find its first resistance at 1.1715, and a rise through could take it to the next resistance level of 1.1745. For today the expected trading range is between 1.1633, Support and 1.1715
The expected trend for today is Bullish.
Supports Levels: Support 1: 1.1633, Support 2: 1.1585, Support 3: 1.1553
Resistance Levels: Resistance 1: 1.1715, Resistance 2: 1.1745, Resistance 3: 1.1795
Previous day`s high: 1.1689
Previous day`s low: 1.1619
EUR/USD Buying Opportunity for Intraday Trading September 18, 2018
Buy near the support area 1.1633 and 1.1585 as soon as you get reversal candlesticks patterns like Hammer, Bullish Englufing, Long Leged Doji or Dragonfly Doji, using stop loss 2 pips below the reversal candlestick & keep target equal to stop loss.
EUR/USD Selling Opportunity for Intraday Trading September 18, 2018
Sell near the resistance area 1.1715 and 1.1745 as soon as you get reversal candlesticks patterns like Shooting Star, Bearish Englufing, Long Leged Doji or Gravestone Doji, using stop loss 2 pips above the reversal candlestick & keep target equal to stop loss.
GBP/USD Technical Analysis September 18, 2018
USD/JPY Technical Analysis September 18, 2018
USD/CAD Technical Analysis September 18, 2018