
GBP USD Technical Analysis September 20, 2018
The GBP declined 0.04% against the USD on Wednesday and closed at 1.3141. Today in the European session while preparing GBP USD technical analysis September 20, 2018 at 9:45 GMT, the GBP/USD is trading at 1.3200, which is 0.44% higher against the USD from yesterday’s close.
In European session, data showed that the UK interest rate: After raising the interest rate by 25 basis points at the last meeting, the Bank of England voted unanimously to keep the bank interest rate unchanged at 0.75% on September 13, 2018. The decision is in line with market expectations.
UK inflation rate: The UK consumer price index rose from 2.5% in August 2018 to 2.7% in August 2011, and was higher than market expectations of 2.4%. This is the highest inflation rate since February, driven mainly by transportation, entertainment and culture, as well as rising prices for food and non-alcoholic beverages.
UK core inflation rate: The UK’s annual core inflation rate (excluding energy, food, alcohol and tobacco prices) rose to a four-month high of 2.1% in August 2018, up from 1.9% in July, higher than market expectations of 1.8%.
GBP USD Technical Analysis September 20, 2018
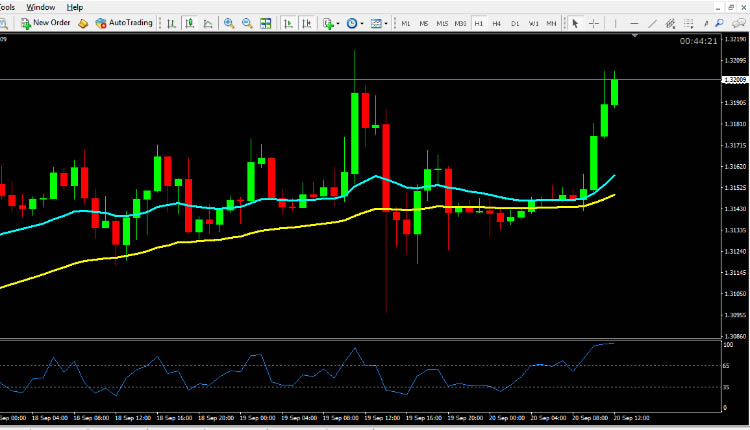
The pair is expected to find support at 1.3087, and a fall through could take it to the next support level of 1.3033 The pair is expected to find its first resistance at 1.3205, and a rise through could take it to the next resistance level of 1.3268. For today the expected trading range is between 1.3095, Support and 1.3225 Resistance.
The expected trend for today is Bullish
Supports Levels: Support 1: 1.3087 Support 2: 1.3033 Support 3: 1.2970
Resistance Levels: Resistance 1: 1.3205 Resistance 2: 1.3268 Resistance 3: 1.3322
Previous day`s high: 1.3214
Previous day`s low: 1.3096
GBP/USD Buying Opportunity for Intraday Trading September 20, 2018
Buy near the support area 1.3187 and 1.3033 as soon as you get reversal candlesticks patterns like Hammer, Bullish Englufing, Long Leged Doji or Dragonfly Doji, using stop loss 2 pips below the reversal candlestick & keep target equal to stop loss.
EUR/USD Selling Opportunity for Intraday Trading September 20, 2018
Sell near the resistance area 1.3205 and 1.3268 as soon as you get reversal candlesticks patterns like Shooting Star, Bearish Englufing, Long Leged Doji or Gravestone Doji, using stop loss 2 pips above the reversal candlestick & keep target equal to stop loss.
EUR/USD Technical Analysis September 20, 2018
USD/JPY Technical Analysis September 20, 2018
USD/CAD Technical Analysis September 20, 2018