
GBP USD Technical Analysis September 28, 2018
The GBP declined 0.54% against the USD on Thursday and closed at 1.3075. Today in the Asian session while preparing GBP USD technical analysis September 28, 2018 at 10:15 GMT, the GBP/USD is trading at 1.3050, which is 0.19% lower against the USD from yesterday’s close.
When the European market opens, the economic data will release such as UK GDP growth rate: The UK’s GDP grew by 1.3% year-on-year in the second quarter of 2018, which is less than the previous year’s nearly six-year low of 1.2% and the supporting market.
UK GDP growth: preliminary estimates show that the UK economy grew by 0.4% in the three months to June 2018, up 0.2% in the previous quarter, in line with market expectations.
GBP USD Technical Analysis September 28, 2018
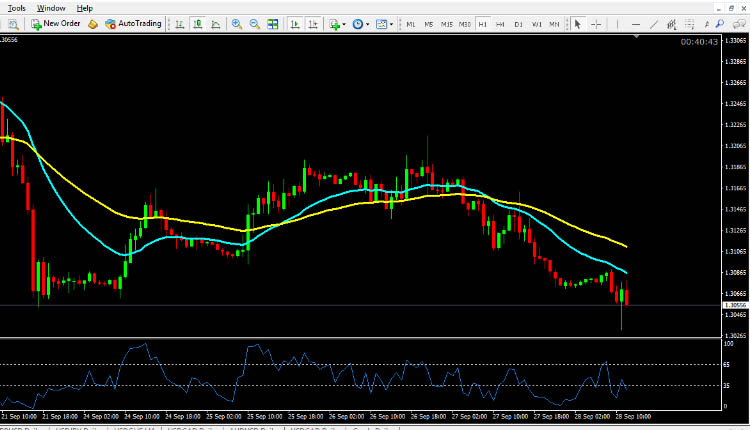
The pair is expected to find support at 1.3040, and a fall through could take it to the next support level of 1.3000 The pair is expected to find its first resistance at 1.3143, and a rise through could take it to the next resistance level of 1.3212. For today the expected trading range is between 1.3000, Support and 1.3143 Resistance.
The expected trend for today is Bearish
Supports Levels: Support 1: 1.3040 Support 2: 1.3000 Support 3: 1.2935
Resistance Levels: Resistance 1: 1.3143 Resistance 2: 1.3212 Resistance 3: 1.3247
Previous day`s high: 1.3177
Previous day`s low: 1.3073
GBP/USD Buying Opportunity for Intraday Trading September 28, 2018
Buy near the support area 1.3040 and 1.3000 as soon as you get reversal candlesticks patterns like Hammer, Bullish Englufing, Long Leged Doji or Dragonfly Doji, using stop loss 2 pips below the reversal candlestick & keep target equal to stop loss.
EUR/USD Selling Opportunity for Intraday Trading September 28, 2018
Sell near the resistance area 1.3143 and 1.3212 as soon as you get reversal candlesticks patterns like Shooting Star, Bearish Englufing, Long Leged Doji or Gravestone Doji, using stop loss 2 pips above the reversal candlestick & keep target equal to stop loss.
EUR/USD Technical Analysis September 28, 2018
USD/JPY Technical Analysis September 28, 2018
USD/CAD Technical Analysis September 28, 2018